日別アーカイブ: 2026年4月9日

Thyristor Research:industrial control represents the largest share at about 34%

Thyristor Market Summary

I. Global Thyristor Market Overview

A thyristor is a power semiconductor device featuring a PNPN four-layer structure, or an equivalent structure, with three terminals: anode, cathode, and gate. It is triggered by the gate to switch from the off state to the on state and remains conductive until the current falls below the holding value or a reverse voltage is applied. In addition to conventional unidirectional thyristors, such as SCRs, and bidirectional thyristors, such as TRIACs, this study also includes thyristor modules such as GTOs, or Gate Turn-Off Thyristors, and IGCTs, or Integrated Gate-Commutated Thyristors, which offer higher switching capability and are better suited for high-voltage, high-current applications.


Source: Secondary Sources and QYResearch, 2026

Figure00002. Global Thyristor Market Size (US$ Million), 2025 vs 2032

Thyristor

Above data is based on report from QYResearch: Global Thyristor Market Report 2026-2032 (published in 2026). If you need the latest data, plaese contact QYResearch.


The global thyristor industry, including conventional SCRs, bidirectional thyristors, and modular GTO and IGCT products, is in a stage of steady development, with its core trend reflected in the evolution of power electronic systems toward higher voltage, higher current, greater power capacity, and modularization. In terms of product structure, thyristors can be classified by device type into conventional SCRs, bidirectional thyristors such as TRIACs, and modular devices such as GTOs and IGCTs. They can also be segmented by power rating, ranging from several tens of amperes to several thousand amperes, and by voltage rating, ranging from several hundred volts to several thousand volts. By application structure, the market covers industrial control, power transmission, new energy systems, traction transportation, computing, and communications. From a regional perspective, Asia-Pacific is the largest market globally, accounting for about 61% of the total, followed by Europe and North America. In terms of competitive landscape, leading global manufacturers include STMicroelectronics, Renesas Electronics, Littelfuse, and WeEn Semiconductors, with the top four players together accounting for about 54% of the market. By application, industrial control represents the largest share at about 34%, followed by consumer electronics at 28% and computing and communications at 22%.


In terms of cost structure, the main components include power devices, accounting for about 45% to 55% of total cost, as well as packaging and structural parts, drive and control circuits, testing and certification, and manufacturing labor. Along the industry chain, the upstream mainly consists of power semiconductor chips and modules, the midstream covers thyristor packaging and complete-unit manufacturing, and the downstream includes integrators in automation equipment, power systems, new energy systems, and communications infrastructure. Overall industry gross margin remains at a favorable level, and there is still profit potential for new entrants. Looking ahead, thyristor devices are moving toward higher current capacity, higher voltage resistance, faster switching response, wider temperature tolerance, and more modular and intelligent management. At the same time, wide-bandgap materials such as SiC and GaN are beginning to be incorporated into substitution pathways and are expected to become a mainstream direction for next-generation high-end thyristor modules.


II. Analysis of Market Drivers in 2026


In 2026, demand in the thyristor market continues to be supported by a diverse range of downstream applications, covering automotive and transportation, industrial control, consumer electronics, computing and communications, as well as other power electronics scenarios. Among them, high-voltage and high-power thyristors and related devices mainly benefit from grid upgrading, renewable energy grid connection, industrial power supplies, special power supplies, and the construction of high-power control systems. Standardized devices are widely used in home appliance control, power supply protection, lighting regulation, automotive electronics, and communications support. Overall, the demand structure of the thyristor industry is characterized by the parallel development of project-driven markets and device-driven markets, with clear differences in growth pace and application logic across different product segments.


III. Development Opportunities Over the Next Five Years


Over the next five years, development opportunities in the thyristor industry are expected to be reflected mainly in three areas. First, as the construction of new-type power systems continues to advance, applications such as flexible DC transmission, grid-related equipment, energy storage conversion, and high-power industrial control will continue to drive demand for high-voltage and high-power devices. Second, the ongoing upgrading of industrial automation, automotive electronics, power management, and highly reliable control systems will provide stable incremental demand for mid- to high-end thyristor devices. Third, major domestic companies are continuing to advance the industrialization of thyristor devices and modules such as IGCT, indicating that the industry still has strong potential for technological upgrading and domestic substitution. Overall, future opportunities are expected to be concentrated more in product segments with higher reliability, higher power density, and stronger customization capabilities.


IV. Factors Restraining Development in 2026


From the perspective of industry operations, the main pressure facing the thyristor market in 2026 still comes from structural competition. On the one hand, competition in general-purpose and standardized products remains intense, and price fluctuation and pressure on profitability continue to be common across the industry. On the other hand, although demand for high-end products is relatively stable, long customer qualification cycles, the pace of project introduction, R&D intensity, and delivery capability still place high requirements on enterprises. In addition, in certain application scenarios, thyristors also face substitution or diversion pressure from other power semiconductor devices. As a result, industry growth is reflected more in structural opportunities within specific segments rather than broad-based expansion across all product categories.


V. Outlook on Industry Development Trends


Overall, the thyristor industry in 2026 is expected to continue showing the characteristics of premiumization, application differentiation, and structural upgrading. Demand certainty remains relatively strong for high-voltage, high-power, and engineering-support products, and the market focus is expected to further shift toward power grids, renewable energy, industrial control, and high-reliability application fields. Standard devices will continue to maintain broad application in consumer electronics, automotive and transportation, and computing and communications, but the key areas of competition will increasingly center on cost control, product consistency, and customer coverage capability. Over the next few years, companies with advantages in technology platforms, accumulated project experience, and downstream customer qualification capability are expected to further strengthen their competitive positions as the industry continues to differentiate.


About the Authors

Wei Qin – Electronics Industry Analyst

qinwei@qyresearch.com


Focusing on the electronics and communications field for a long time, she has observed, followed up and researched on various links in the industry chain, such as semiconductors, consumer electronics, home appliances, fiber optic communications, Internet of Things (IoT) and smart home for a long time. He has rich experience in industry research and has completed many successful cases.


About QYResearch

QYResearch founded in California, USA in 2007.It is a leading global market research and consulting company. With over 17 years’ experience and professional research team in various cities over the world QY Research focuses on management consulting, database and seminar services, IPO consulting (data is widely cited in prospectuses, annual reports and presentations), industry chain research and customized research to help our clients in providing non-linear revenue model and make them successful. We are globally recognized for our expansive portfolio of services, good corporate citizenship, and our strong commitment to sustainability. Up to now, we have cooperated with more than 60,000 clients across five continents. Let’s work closely with you and build a bold and better future.

QYResearch is a world-renowned large-scale consulting company. The industry covers various high-tech industry chain market segments, spanning the semiconductor industry chain (semiconductor equipment and parts, semiconductor materials, ICs, Foundry, packaging and testing, discrete devices, sensors, optoelectronic devices), photovoltaic industry chain (equipment, cells, modules, auxiliary material brackets, inverters, power station terminals), new energy automobile industry chain (batteries and materials, auto parts, batteries, motors, electronic control, automotive semiconductors, etc.), communication industry chain (communication system equipment, terminal equipment, electronic components, RF front-end, optical modules, 4G/5G/6G, broadband, IoT, digital economy, AI), advanced materials industry Chain (metal materials, polymer materials, ceramic materials, nano materials, etc.), machinery manufacturing industry chain (CNC machine tools, construction machinery, electrical machinery, 3C automation, industrial robots, lasers, industrial control, drones), food, beverages and pharmaceuticals, medical equipment, agriculture, etc.

About Us:
QYResearch founded in California, USA in 2007, which is a leading global market research and consulting company. Our primary business include market research reports, custom reports, commissioned research, IPO consultancy, business plans, etc. With over 18 years of experience and a dedicated research team, we are well placed to provide useful information and data for your business, and we have established offices in 7 countries (include United States, Germany, Switzerland, Japan, Korea, China and India) and business partners in over 30 countries. We have provided industrial information services to more than 60,000 companies in over the world.

Contact Us:
If you have any queries regarding this report or if you would like further information, please contact us:
QY Research Inc.
Add: 17890 Castleton Street Suite 369 City of Industry CA 91748 United States
EN: https://www.qyresearch.com
Email: global@qyresearch.com
Tel: 001-626-842-1666(US)
JP: https://www.qyresearch.co.jp

カテゴリー: 未分類 | 投稿者huangsisi 12:29 | コメントをどうぞ

Medical Silicone Seals Research:rate (CAGR) of 6.8% in the next few years

Medical Silicone Seals Market Summary

According to the latest report “Global Medical Silicone Seals Market Report 2025-2031″ by the QYResearch research team, the global Medical Silicone Seals market size is expected to reach US$4.715 billion in 2031, with a compound annual growth rate (CAGR) of 6.8% in the next few years.

Medical silicone seals are specialized sealing components manufactured from high-purity silicone elastomers using platinum- or peroxide-catalyzed curing processes; they are specifically designed for applications involving medical devices, pharmaceutical equipment, and human implants. Their defining characteristic is exceptional biocompatibility—meeting both USP Class VI and ISO 10993 standards—ensuring that they exhibit no cytotoxicity or sensitization reactions when in contact with human tissues or pharmaceutical fluids. Furthermore, these seals offer broad temperature resistance (ranging from -40°C to 232°C), withstand repeated steam sterilization and chemical cleaning, and demonstrate excellent resistance to aging and the leaching of harmful substances during long-term use. Product forms encompass O-rings, gaskets, custom-profile seals, valve diaphragms, and integrated multi-component assemblies. Widely deployed in critical applications—such as syringe plungers, hemodialysis tubing systems, and sterile bioreactor interfaces—these seals serve as fundamental components essential for safeguarding medical safety and ensuring the purity of pharmaceutical fluids.

The market for medical silicone seals is generally exhibiting a steady upward trend, driven primarily by the continuous expansion and product upgrades within the medical device industry. On one hand, factors such as an aging global population, a rising prevalence of chronic diseases, and expanded healthcare coverage have significantly amplified the demand for disposable medical consumables—particularly in applications such as infusion, injection, respiratory support, and dialysis—thereby fueling a sustained increase in the fundamental demand for silicone seals. On the other hand, as medical devices evolve toward greater precision, miniaturization, and long-term operational stability, stricter requirements are being imposed on the cleanliness, biocompatibility, and dimensional consistency of seals; this trend is driving the industry toward a transformation characterized by high-end, precision-oriented manufacturing. Concurrently, increasingly stringent regulatory standards—encompassing areas such as sterile manufacturing, product traceability, and material safety certification—have raised the industry’s barriers to entry while enabling leading enterprises to consolidate their market positions by leveraging their robust quality management systems and certification credentials.

From a regional perspective, enterprises in Europe and North America continue to hold a leading edge in the high-end segment; however, emerging markets—such as China—are rapidly accelerating the process of domestic substitution and penetrating the mid-to-high-end market segments, capitalizing on their strengths in cost control and large-scale manufacturing capabilities.

Looking ahead, driven by advancements in novel medical equipment, minimally invasive surgical instruments, and the biopharmaceutical sector, medical silicone seals are poised to unlock significant growth potential within high-value-added applications. Consequently, industry competition is expected to gradually shift away from a price-centric focus toward a comprehensive rivalry centered on technology, quality, and service excellence.

The development of the medical silicone seal market is primarily propelled by a confluence of factors: specifically, the growing demand from the downstream medical device industry and continuous advancements in material science and technology.

First, the global medical device market continues to expand—particularly through the rapid growth of both disposable and reusable instruments such as syringes, catheters, ventilators, and infusion systems—which directly stimulates the demand for high-performance sealing components.

Second, as requirements for the safety, reliability, and long-term durability of medical devices become more rigorous, medical silicone seals have emerged as the preferred material choice. This preference stems from their inherent advantages, including excellent biocompatibility, resistance to extreme temperatures, chemical inertness, and stable sealing performance. Furthermore, ongoing optimizations in material R&D and processing techniques—including the development of modified silicones, precision injection molding, and automated production technologies—enable seals to be more precisely tailored to the complex structural designs of medical devices, thereby enhancing both production efficiency and product consistency.

Third, the tightening of regulatory frameworks and quality standards compels enterprises to continuously elevate their product quality and certification credentials in order to meet the diverse safety and regulatory compliance requirements mandated by various national authorities for medical devices. Furthermore, global population aging and the growing demand for chronic disease management have also fueled a sustained demand for seals in sectors such as respiratory therapy, dialysis, and wearable medical devices.

Taken together, the expansion of downstream markets, technological advancements, regulatory initiatives, and demographic health trends are collectively driving the continued growth of the medical silicone seal industry, while also prompting enterprises to strategically position themselves toward high-value-added and customized solutions.

This report profiles key players of Medical Silicone Seals such as Elasto Proxy、Apple Rubber Products、Precision Associates,Inc.、Elastostar、Stockwell Elastomerics、Newman Sanitary Gasket、SBR Life Sciences、Suconvey Rubber、JIOrings、Relss Manufacturing,Inc.、Saint-Gobain ICS、Hennig Gasket& Seals、DP Seals、ELASTA、Shenzhen Feiyue Rubber & Plastic Co., Ltd.、Jefferson Rubber Works、Aobo (Dongguan) Precision Silicone Rubber Products Co., Ltd.、Automated Gasket Corporation、LegenDay、ElastaPro

The industrial chain for medical silicone seals constitutes a comprehensive ecosystem, anchored by high-end upstream materials, driven by critical midstream precision manufacturing, and propelled by broad downstream applications. Each segment of this value chain is tightly integrated, collectively underpinning the advancement of the modern medical device and pharmaceutical industries. The following sections provide a detailed breakdown of these three distinct segments: upstream, midstream, and downstream.

Upstream Segment: Supply of Medical-Grade Silicone Raw Materials and Core Equipment

The upstream segment of the industrial chain primarily supplies the foundational raw materials and production equipment required for manufacturing medical silicone seals; the quality and technological sophistication of these inputs directly determine the safety and performance of the final products.

Regarding upstream raw materials, medical-grade silicone is broadly categorized into two main types: platinum-cured silicone and peroxide-cured silicone. Platinum-cured silicone—distinguished by its exceptional purity, extremely low levels of extractables, and superior biocompatibility—has become the material of choice for high-end medical devices and implantable applications. Conversely, peroxide-cured silicone offers cost advantages and is suitable for standard medical components where requirements regarding extractables are relatively less stringent. As the industry places increasing emphasis on environmental protection and sustainability, novel materials—such as biodegradable silicones—are currently under development, injecting fresh technological vitality into the upstream segment of the value chain.

In terms of upstream equipment, Liquid Silicone Rubber (LSR) injection molding machines serve as the core machinery for producing high-precision medical silicone seals. These machines are capable of injection molding micro-seals with complex geometries at extremely high levels of precision, thereby ensuring product consistency and stability.

The technological barriers within the upstream segment primarily manifest in areas such as the formulation R&D of high-end medical-grade silicones, the rigorous control of extractables, and the performance enhancement of precision molding equipment. Obtaining material certifications that comply with international standards—such as USP Class VI and ISO 10993—constitutes a critical threshold for entry into this specialized field.

Midstream Segment: Precision Manufacturing and Market Competitive Landscape

The midstream segment of the industrial chain represents the core operational phase, encompassing the mold design, injection molding, post-processing, and quality inspection of medical silicone seals. This segment serves as a hub for major manufacturers—both globally and within China—giving rise to a competitive landscape in which both technological prowess and cost-efficiency are of paramount importance.

From the perspective of manufacturing processes, Liquid Silicone Rubber (LSR) injection molding has emerged as the dominant technology within the industry. This process enables full-workflow automation—spanning automatic feeding, vulcanization molding, automated deflashing, cleaning, and visual inspection—thereby significantly boosting production efficiency and product yield.

From the perspective of the global market landscape, the medical silicone seals industry is characterized by the coexistence of international enterprises and local manufacturers. Leading international firms, leveraging their deep technological expertise and global service networks, dominate the high-end market segment. Meanwhile, local Chinese manufacturers have experienced rapid growth in recent years; through continuous improvements in technological capabilities and cost control, they have established strong market competitiveness.

Notably, the synergistic effects between the upstream and downstream segments of the industry chain are particularly pronounced within the midstream manufacturing stage.

Downstream of the Industry Chain: Application Fields and End Customers.

The downstream segment of the industry chain constitutes the application market for medical silicone seals, encompassing core sectors such as pharmaceutical equipment, medical devices, and in vitro diagnostics. The scale and structural characteristics of downstream demand directly dictate the future development trajectory of the entire industry chain.

In terms of specific application scenarios, medical silicone seals are widely utilized in:

Blood Purification Equipment: Components such as O-rings and three-way valves found in hemodialysis machines, which serve as critical elements for ensuring treatment safety;

Drug Delivery Systems: Components such as pistons and seals for insulin pumps, auto-injectors, and pre-filled syringes, which require strict compatibility with pharmaceutical fluids and absolute leak-proof integrity;

Respiratory and Anesthesia Equipment: Seals used in ventilators, anesthesia masks, and CPAP devices, which demand exceptionally high levels of airtightness and patient comfort;

Implantable Medical Devices: Seals for devices such as cardiac pacemakers and neurostimulators, which must exhibit long-term biological stability and resistance to degradation;

Diagnostic and Monitoring Equipment: Sealing assemblies found in devices such as blood glucose monitors and blood analyzers, which facilitate precise testing and real-time medical monitoring.

The core demands of the downstream market regarding medical silicone seals center on factors such as biocompatibility, sterilization resistance, and long-term reliability. Compliance certifications—adhering to international standards such as ISO 10993 and USP Class VI, as well as regulatory frameworks like the FDA and the EU MDR—are indispensable prerequisites for products seeking entry into the global market.

Looking ahead, the medical silicone seals industry chain is evolving toward greater high-performance capabilities, miniaturization, intelligence, and sustainability.

On the technological front, miniaturization and the fabrication of complex geometric shapes represent key directions for future development. With the advancement of minimally invasive surgical instruments, wearable medical devices, and sophisticated drug delivery systems, the demand for precision seals—at the millimeter or even micron scale—is steadily rising. This trend places increasingly rigorous demands on micro-molding and Liquid Silicone Rubber (LSR) injection molding technologies. Concurrently, the integration of embedded intelligent functions is emerging as a new trend; by incorporating sensors for temperature, pressure, and flow rate directly into seals, manufacturers can enable real-time monitoring and diagnostic capabilities within medical devices, thereby driving the evolution of medical components toward greater intelligence.

At the material level, enhancing biocompatibility and sterilization resistance remains a persistent technical objective. This is achieved by optimizing silicone formulations to minimize extractables and leachables, while simultaneously boosting resistance to sterilization methods such as high-pressure steam, ethylene oxide, and gamma radiation. Such advancements ensure that seals meet the long-term safety requirements of critical applications, including implantable devices and surgical instruments.

From a market perspective, the rapid expansion of single-use devices and home-use medical equipment presents new opportunities across the entire industry value chain. The imperative for infection control has driven the widespread adoption of disposable medical devices, creating a need for cost-effective, mass-produced medical silicone seals. Meanwhile, the rise of home-based devices—such as continuous glucose monitors and smart patches—has imposed new requirements on seals regarding skin compatibility and flexibility.

Overall, the medical silicone seal industry is undergoing a transformative upgrade, shifting from basic manufacturing toward high-end, intelligent manufacturing. The independent development of advanced upstream materials, the intelligent upgrading of midstream precision manufacturing processes, and the continuous expansion of downstream application fields collectively constitute the central trajectory for the industry’s future growth.

The competitive landscape for medical silicone seals is characterized by the following features:

When viewed through a stratified lens, the high-end market is dominated by internationally renowned medical material suppliers. These firms leverage their mature silicone formulations, high-precision processing techniques, and rigorous quality management systems to supply products primarily to manufacturers of sophisticated medical instruments and high-standard, single-use devices—emphasizing attributes such as biocompatibility, resistance to high-temperature sterilization, and long-term reliability. The mid-range market is populated primarily by regional enterprises that possess a certain level of technical expertise and mass-production capabilities; their products strike a balance between performance and cost, catering mainly to applications involving standard syringes, catheters, and lower-risk medical devices. The low-end market features a multitude of participants—predominantly small, local processing firms—where competition is driven primarily by price, and products are typically utilized in non-critical components or lower-tier medical consumables. Overall, the medical silicone seal industry is characterized by a landscape in which international brands dominate the high-end market, while regional enterprises engage in fierce competition within the mid-to-low-end segments. As medical devices become increasingly sophisticated and customized—and as regulatory standards continue to rise—companies possessing strong R&D capabilities, large-scale production capacity, and relevant certifications are poised to gradually expand their market share; consequently, industry concentration is expected to increase further.


About QYResearch

QYResearch founded in California, USA in 2007.It is a leading global market research and consulting company. With over 17 years’ experience and professional research team in various cities over the world QY Research focuses on management consulting, database and seminar services, IPO consulting (data is widely cited in prospectuses, annual reports and presentations), industry chain research and customized research to help our clients in providing non-linear revenue model and make them successful. We are globally recognized for our expansive portfolio of services, good corporate citizenship, and our strong commitment to sustainability. Up to now, we have cooperated with more than 60,000 clients across five continents. Let’s work closely with you and build a bold and better future.

QYResearch is a world-renowned large-scale consulting company. The industry covers various high-tech industry chain market segments, spanning the semiconductor industry chain (semiconductor equipment and parts, semiconductor materials, ICs, Foundry, packaging and testing, discrete devices, sensors, optoelectronic devices), photovoltaic industry chain (equipment, cells, modules, auxiliary material brackets, inverters, power station terminals), new energy automobile industry chain (batteries and materials, auto parts, batteries, motors, electronic control, automotive semiconductors, etc.), communication industry chain (communication system equipment, terminal equipment, electronic components, RF front-end, optical modules, 4G/5G/6G, broadband, IoT, digital economy, AI), advanced materials industry Chain (metal materials, polymer materials, ceramic materials, nano materials, etc.), machinery manufacturing industry chain (CNC machine tools, construction machinery, electrical machinery, 3C automation, industrial robots, lasers, industrial control, drones), food, beverages and pharmaceuticals, medical equipment, agriculture, etc.

About Us:
QYResearch founded in California, USA in 2007, which is a leading global market research and consulting company. Our primary business include market research reports, custom reports, commissioned research, IPO consultancy, business plans, etc. With over 18 years of experience and a dedicated research team, we are well placed to provide useful information and data for your business, and we have established offices in 7 countries (include United States, Germany, Switzerland, Japan, Korea, China and India) and business partners in over 30 countries. We have provided industrial information services to more than 60,000 companies in over the world.

Contact Us:
If you have any queries regarding this report or if you would like further information, please contact us:
QY Research Inc.
Add: 17890 Castleton Street Suite 369 City of Industry CA 91748 United States
EN: https://www.qyresearch.com
Email: global@qyresearch.com
Tel: 001-626-842-1666(US)
JP: https://www.qyresearch.co.jp

カテゴリー: 未分類 | 投稿者huangsisi 12:27 | コメントをどうぞ

Medical Laser Rental Service Research:compound annual growth rate (CAGR) of 11.2% in the next few years

Medical Laser Rental Service Market Summary

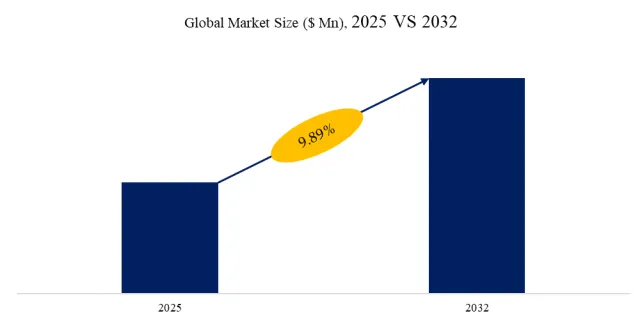
According to the latest report “Global Medical Laser Rental Service Market Report 2025-2031″ by the QYResearch research team, the global Medical Laser Rental Service market size is expected to reach US$1.953 billion in 2031, with a compound annual growth rate (CAGR) of 11.2% in the next few years.

Medical laser rental services represent an equipment utilization model tailored for healthcare institutions, offering temporary or long-term access to high-performance laser devices through leasing rather than outright purchase. This approach aims to alleviate the pressure of capital expenditures on hospitals and clinics while simultaneously meeting their needs for flexible equipment usage. The service encompasses a wide array of medical laser types—including CO2 lasers, diode lasers, Nd:YAG lasers, and pulsed dye lasers—and finds extensive application across disciplines such as dermatology, ophthalmology, dentistry, general surgery, and aesthetic medicine. Service packages typically include equipment installation, operational training, routine maintenance, and technical support; lease terms can be flexibly structured on a daily, monthly, or annual basis to accommodate the diverse clinical requirements of healthcare institutions of varying sizes. This leasing model empowers healthcare providers to achieve greater flexibility in upgrading their equipment fleets while simultaneously minimizing asset idle rates and depreciation costs. The upstream segment of this industry involves laser manufacturers and suppliers of core optical components, while the downstream segment targets hospitals, clinics, and specialized medical aesthetic centers. Driven by the growing demand among healthcare institutions for cost containment and efficient equipment utilization—coupled with the expanding multidisciplinary application of laser technology—medical laser rental services have emerged as a vital complementary model within the broader medical equipment service sector, demonstrating continuously expanding market potential.

From a holistic market perspective, medical laser rental services are gradually transitioning from a supplementary option to a mainstream equipment procurement strategy. The primary drivers behind this shift are the tightening of capital expenditure budgets within healthcare institutions and the significantly accelerated upgrade cycles for high-end laser equipment. While demand for multi-wavelength, multi-functional laser systems continues to rise across surgery, dermatology, ophthalmology, and medical aesthetics, the high unit costs, rapid technological obsolescence, and inherent risks of asset idleness associated with such devices make “leasing over buying” a distinctly advantageous strategy in terms of cost control and technological agility. Consequently, the market penetration rate of rental services has seen particularly pronounced growth among small-to-medium-sized hospitals and private healthcare institutions.

In terms of regional and demand-side structures, the North American and European markets are characterized by mature regulatory frameworks and clearly defined requirements within specialized medical fields; consequently, rental services in these regions tend to focus on high-end surgical and ophthalmological laser systems. The Asia-Pacific region, conversely, is benefiting from the expansion of healthcare service capacity and the growth of consumer spending on medical aesthetics; demand here leans more toward lasers for dermatological and minimally invasive treatments, characterized by rapid growth rates but also more intense price competition. Overall, it is projected that medical laser rental services will become a pivotal pathway for the commercialization of high-value medical equipment in the future—offering long-term growth potential characterized by stable cash flows, scalable business models, and synergistic value amplification through integration with consumables and data-driven services. The growth of medical laser rental services is primarily driven by a confluence of factors.

First and foremost, the need for healthcare institutions to control equipment investment costs serves as the core driving force; given the high price tags associated with high-performance lasers, the leasing model significantly reduces capital expenditure and alleviates depreciation pressures—making it particularly well-suited for small-to-medium-sized hospitals and private clinics.

Secondly, the rapid pace of technological advancement is another critical factor; as medical lasers undergo frequent iterations, leasing enables institutions to flexibly upgrade their equipment, thereby maintaining the cutting edge of clinical technology without incurring the long-term risks associated with outright ownership.

Thirdly, the demand for healthcare services continues to rise—particularly in the fields of dermatology, ophthalmology, dentistry, and medical aesthetics—where increasing patient volumes and treatment frequencies are fueling a growing need for the flexible availability of laser systems.

Furthermore, increasingly stringent regulatory policies and medical device market access requirements are prompting institutions to rely more heavily on service providers for equipment training, maintenance, and compliance support, thereby mitigating operational risks.

Finally, the enhanced service integration capabilities inherent in the leasing model—including remote monitoring, routine maintenance, and operational training—enable hospitals to utilize their equipment resources more efficiently and boost overall clinical operational effectiveness. Taken together, cost control, technological innovation, growing market demand, and service convenience collectively serve as the driving forces behind the continued expansion of the medical laser rental services market.

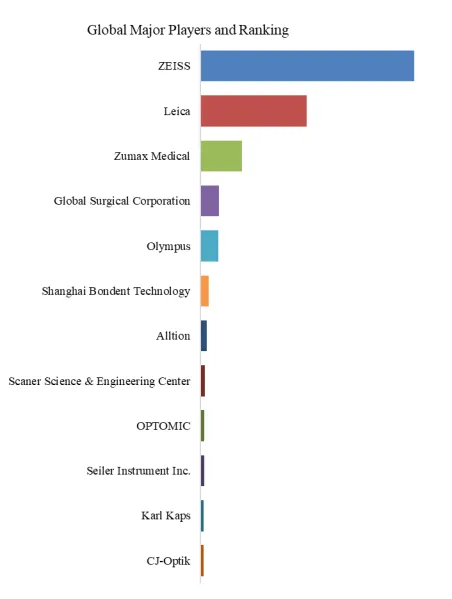
This report profiles key players of Medical Laser Rental Service such as Agiliti、Monarch、HealthTronics、Laser RX、Southeast Laser、Laser Service Solutions、Advanced Surgical Technologies、VMS Biomedical、Nuderma Esthetique、Allura Glow LLP、Lasers2u、MapQuest、Med One Group、Luxinar、Phoxton.

The value chain of medical laser rental services constitutes a comprehensive industrial ecosystem centered on equipment manufacturers and rental service providers, bolstered by capital support, and driven by the demand from end-user medical institutions. Built around the “lease-over-buy” business model, this value chain efficiently bridges the gap between high-end laser equipment and the demand for medical services, thereby emerging as a pivotal pathway for the commercialization of high-value medical devices. The following sections provide a detailed breakdown of this value chain across its three distinct segments: upstream, midstream, and downstream.

Upstream of the Value Chain: Laser Equipment Manufacturing and Capital Supply.

The upstream segment of the value chain primarily encompasses two core elements: the R&D and manufacturing of medical laser equipment, and the capital resources that facilitate equipment procurement. Together, these elements constitute the material foundation and financial guarantee upon which rental services are built.

In the equipment manufacturing segment, upstream suppliers consist primarily of manufacturers producing various types of medical lasers. The products manufactured by these firms span a diverse range of categories, including aesthetic lasers (such as picosecond and CO2 lasers), surgical lasers (used in fields such as urology and gynecology), and ophthalmic lasers (such as femtosecond lasers). The equipment itself is characterized by high unit costs, rapid technological iteration, and demanding maintenance requirements; the acquisition cost for a single piece of high-end medical laser equipment can range from hundreds of thousands to millions of RMB, making it financially burdensome—if not prohibitive—for many medical institutions to bear the upfront capital pressure of a direct purchase.

In the capital support segment, financial leasing companies and leasing platforms established directly by equipment manufacturers play a pivotal role. Licensed financial institutions—exemplified by firms such as CITIC Financial Leasing and Hongzhan Financial Leasing—provide medical institutions with the necessary capital for equipment procurement through methods such as “direct leasing” or “sale-leaseback” arrangements, with cumulative funding amounts reaching into the hundreds of millions of RMB. These financial institutions forge close collaborative ties with equipment manufacturers, establishing a synergistic mechanism wherein “manufacturers recommend equipment—financial institutions fund the purchase—medical institutions lease and utilize the equipment.” Furthermore, in an effort to expand market share and accelerate capital turnover, equipment manufacturers have begun establishing their own leasing platforms or engaging in deep-level cooperation with professional leasing firms; this strategy streamlines intermediate channels and enhances the overall efficiency of the value chain.

The core value of the upstream segment lies in lowering the financial entry threshold for medical institutions, thereby enabling high-end laser technologies to be integrated into clinical practice in a more flexible and accessible manner.

Midstream of the Value Chain: Rental service Providers and Business Model Innovation.

The midstream segment of the value chain constitutes the operational core of the rental service ecosystem. It is primarily composed of professional rental service providers responsible for a comprehensive range of functions, including equipment procurement, inventory management, client acquisition, equipment delivery, and full-lifecycle operation and maintenance support. In terms of business models, midstream service providers are continuously innovating the forms of their leasing products to meet the diverse needs of various healthcare institutions. Based on the specific leasing method employed, these offerings can be categorized into the following types:

**All-inclusive Leasing:** Service providers furnish a comprehensive suite of services—including equipment supply, installation, maintenance, consumables provision, and operational training. Healthcare institutions pay a fixed fee on a recurring basis; this model is ideal for institutions seeking a “turnkey” operational solution.

**Pay-per-Use Leasing:** This model is suitable for institutions with highly fluctuating surgical volumes or for specific diagnostic and treatment procedures. Healthcare institutions pay based on the actual number of times the equipment is utilized, incurring no costs when the equipment sits idle. It is particularly well-suited for settings such as medical aesthetics clinics and specialized outpatient centers.

**Long-term Financial Leasing:** Typically involving a lease term of 3 to 5 years, this arrangement offers the option to renew the lease or purchase the equipment at a reduced price upon expiration. Essentially serving as an alternative to installment-based purchasing, it is ideal for medium-to-large-scale institutions with stable, long-term equipment requirements.

**Short-term Temporary Leasing:** Designed to address temporary needs—such as during equipment maintenance periods or peak surgical seasons—this model offers lease terms calculated on a daily or weekly basis, thereby providing critical operational backup.

From the perspective of service content, the midstream sector of the industry value chain is evolving from a simple “equipment rental” model toward a comprehensive service paradigm encompassing “equipment + consumables + operations & maintenance + clinical support.” Leading service providers are enhancing customer loyalty and lifetime value by offering value-added services such as periodic calibration, rapid fault response, and regulatory compliance support. This transformation signifies that rental services are no longer merely a simple transfer of equipment usage rights, but rather professional solutions that encompass the entire equipment lifecycle management.

**Downstream Sector: End-User Applications and Demand Drivers**

The downstream sector of the industry value chain comprises the ultimate end-users of rental services—primarily various healthcare institutions and medical aesthetics providers. The specific structure of their demand and their prevailing development trends directly shape the overall trajectory of the entire industry chain.

Based on the types of end-users, the downstream market can be broadly categorized into three main segments:

**General Hospitals:** Large-scale public hospitals typically possess extensive in-house equipment inventories. Consequently, their demand for rental services primarily arises during transitional periods for equipment upgrades and replacements, during temporary departmental capacity expansions, or when piloting new medical programs. Surgical departments—such as Ophthalmology, Urology, and Obstetrics & Gynecology—represent the primary users of these rental services within this segment.

**Private Specialty Hospitals and Medical Aesthetics Institutions:** This segment represents the fastest-growing area for rental services, exhibiting the highest market penetration rates. Private healthcare institutions often operate with relatively limited capital budgets; however, they face an urgent need for advanced medical equipment. The leasing model enables these institutions to provide technical treatments on par with those offered by public hospitals, all while effectively managing their cash flow. Taking Gaochun People’s Hospital in Nanjing as an example: by utilizing a public bidding process to lease Intense Pulsed Light (IPL) and laser systems—specifically ultra-picosecond devices—under a three-year service term with annual contract renewals, the hospital demonstrates the growing acceptance among healthcare institutions of flexible equipment leasing models.

Outpatient Surgery Centers and Imaging Centers: These types of facilities are typically smaller in scale and operate with greater agility. The leasing model enables them to flexibly allocate equipment resources in direct response to patient volume, thereby preventing the underutilization of fixed assets.

In terms of application scenarios, the demand for medical laser leasing spans a wide array of specialized fields, including general surgery, aesthetic dermatology, ophthalmology, and dentistry. Among these, aesthetic dermatology lasers constitute the fastest-growing sub-segment, driven by the sustained surge in demand for “light aesthetics” (non-invasive cosmetic procedures); meanwhile, ophthalmology lasers maintain a steady demand, bolstered by the continuous increase in the volume of myopia correction and cataract surgeries.

Regarding regional demand structures: the North American and European markets are characterized by mature regulatory frameworks and clearly defined clinical specializations, where rental services tend to favor high-end surgical and ophthalmological lasers. Conversely, the Asia-Pacific region—benefiting from the expansion of healthcare service capacity and rising consumer spending on medical aesthetics—exhibits a demand profile that leans more toward lasers for dermatological and minimally invasive treatments; while this segment demonstrates faster growth, it is also subject to more intense price competition. These regional disparities significantly influence the strategic positioning and market approaches adopted by various industry participants.

Industry Chain Support Factors and Development Trends

The healthy functioning of the medical laser leasing industry chain relies on a confluence of supporting factors, while the sector as a whole is simultaneously exhibiting distinct evolutionary trends.

Regarding core growth drivers: the widespread adoption of minimally invasive surgery stands as the primary catalyst for the industry chain’s expansion. Minimally invasive procedures offer distinct advantages—such as faster recovery times, fewer complications, and shorter hospital stays—and have consequently emerged as the future trajectory of modern surgery; laser devices, in turn, serve as the indispensable core tools for executing these procedures.

Regarding core challenges: the substantial costs associated with equipment maintenance and calibration constitute the primary pressure point facing the industry chain. Laser devices require periodic calibration, preventive maintenance, and breakdown repairs performed by specialized technical personnel; service providers must shoulder the burden of managing equipment operations and maintenance across multiple geographic locations, a requirement that significantly inflates operational costs. Furthermore, the operation of these sophisticated devices necessitates specialized training, and a shortage of skilled personnel in certain regions currently constrains service delivery capabilities. Additionally, stringent regulatory frameworks governing the safety of medical devices keep compliance costs consistently high.

Regarding development trends: the industry chain is currently evolving toward greater scale, enhanced intelligence, and a stronger service-oriented focus. Leading leasing firms are expanding their market share through resource integration and capital operations; consequently, industry concentration is expected to rise gradually. Meanwhile, equipment manufacturers are establishing their own leasing platforms to compete directly in the market, thereby narrowing the scope for independent leasing providers. Furthermore, the synergistic effects between rental services, consumables, and data services are becoming increasingly prominent, fostering diversified profit models. In the long run, medical laser rental services are poised to become a pivotal pathway for the commercialization of high-value medical equipment, offering the potential for stable cash flows and scalable replication.

Overall, the medical laser leasing value chain is currently undergoing a critical transition—shifting from a “supplementary model” to a “mainstream configuration.” The synergy between upstream equipment manufacturing and capital supply, the continuous innovation in midstream service models, and the constant expansion of downstream application scenarios collectively form the foundation for the value chain’s robust growth. Looking ahead, driven by the rising adoption of minimally invasive surgeries and the ongoing trend of medical resource decentralization, this value chain is expected to maintain its steady growth trajectory.

The competitive landscape of the medical laser rental service sector is characterized by the following features:

From a segmented perspective, the high-end market is dominated by international medical equipment leasing companies. Leveraging their mature laser product lines, comprehensive maintenance service systems, and strong brand reputation, these firms provide holistic solutions—including equipment upgrades, operational training, and remote technical support—to large-scale hospitals and specialized medical institutions. The mid-range market is led by regional leasing providers and select medical device distributors; these entities cater to the needs of small-to-medium-sized hospitals and private clinics through competitive pricing, flexible lease terms, and localized services. The low-end market, conversely, is populated by a large number of small-scale leasing companies that primarily offer single-unit rentals or short-term usage services; competition in this segment centers mainly on price and accessibility, with relatively limited added value derived from technology and services.

From a regional perspective, the markets in North America and Europe exhibit high levels of concentration, with high-end service providers holding a significant market share. The Asia-Pacific region, while characterized by a large and fragmented pool of market participants, has recently witnessed local enterprises gradually bolstering their competitiveness within the mid-range market, driven by the increasing demand among medical institutions for greater equipment flexibility.

In summary, the medical laser rental service industry presents a competitive landscape characterized by “international brands dominating the high-end market, while regional enterprises and small-scale providers engage in fierce competition within the mid-to-low-end markets.” Moving forward, as the pace of laser technology innovation accelerates and leasing models become increasingly standardized, companies possessing strong technical service capabilities and offering comprehensive system solutions are expected to further expand their market share, thereby driving a gradual increase in overall industry concentration.


About QYResearch

QYResearch founded in California, USA in 2007.It is a leading global market research and consulting company. With over 17 years’ experience and professional research team in various cities over the world QY Research focuses on management consulting, database and seminar services, IPO consulting (data is widely cited in prospectuses, annual reports and presentations), industry chain research and customized research to help our clients in providing non-linear revenue model and make them successful. We are globally recognized for our expansive portfolio of services, good corporate citizenship, and our strong commitment to sustainability. Up to now, we have cooperated with more than 60,000 clients across five continents. Let’s work closely with you and build a bold and better future.

QYResearch is a world-renowned large-scale consulting company. The industry covers various high-tech industry chain market segments, spanning the semiconductor industry chain (semiconductor equipment and parts, semiconductor materials, ICs, Foundry, packaging and testing, discrete devices, sensors, optoelectronic devices), photovoltaic industry chain (equipment, cells, modules, auxiliary material brackets, inverters, power station terminals), new energy automobile industry chain (batteries and materials, auto parts, batteries, motors, electronic control, automotive semiconductors, etc.), communication industry chain (communication system equipment, terminal equipment, electronic components, RF front-end, optical modules, 4G/5G/6G, broadband, IoT, digital economy, AI), advanced materials industry Chain (metal materials, polymer materials, ceramic materials, nano materials, etc.), machinery manufacturing industry chain (CNC machine tools, construction machinery, electrical machinery, 3C automation, industrial robots, lasers, industrial control, drones), food, beverages and pharmaceuticals, medical equipment, agriculture, etc.

About Us:
QYResearch founded in California, USA in 2007, which is a leading global market research and consulting company. Our primary business include market research reports, custom reports, commissioned research, IPO consultancy, business plans, etc. With over 18 years of experience and a dedicated research team, we are well placed to provide useful information and data for your business, and we have established offices in 7 countries (include United States, Germany, Switzerland, Japan, Korea, China and India) and business partners in over 30 countries. We have provided industrial information services to more than 60,000 companies in over the world.

Contact Us:
If you have any queries regarding this report or if you would like further information, please contact us:
QY Research Inc.
Add: 17890 Castleton Street Suite 369 City of Industry CA 91748 United States
EN: https://www.qyresearch.com
Email: global@qyresearch.com
Tel: 001-626-842-1666(US)
JP: https://www.qyresearch.co.jp

カテゴリー: 未分類 | 投稿者huangsisi 12:10 | コメントをどうぞ

Inhaled Nitric Oxide Research:approximately USD 1.08 billion by 2032

Inhaled Nitric Oxide Market Summary

Inhaled Nitric Oxide, or iNO, should be understood first as a medical gas product for inhalation rather than as a hardware-based therapy platform. Its core clinical value lies in its role as a selective pulmonary vasodilator that improves oxygenation and reduces pulmonary vascular resistance, especially in neonatal hypoxic respiratory failure associated with pulmonary hypertension and other highly specialized critical care scenarios. From a market research perspective, the correct statistical boundary is the commercial value of the gas product itself, excluding delivery systems, monitoring devices, and other hardware revenues. Once that boundary is clarified, the industry logic becomes much clearer. This is not a conventional pharmaceutical market driven by broad patient penetration. It is a high-barrier specialized therapeutic gas market shaped by clinical necessity, regulatory qualification, purity control, supply reliability, and hospital access capability.

At the global level, Inhaled Nitric Oxide is not among the loudest healthcare segments, yet it is one of the clearest examples of a high-quality specialty market with durable value. The global iNO market is about USD 730 million in 2025 and is expected to reach approximately USD 1.08 billion by 2032. What matters is not only that the market is expanding, but that its expansion is supported by the strengthening role of Inhaled Nitric Oxide as a high-value therapeutic gas in critical care. The category is moving beyond its earlier identity as a narrowly defined specialist treatment segment and is becoming a higher-quality therapeutic gas market shaped by clinical necessity, supply capability, and professional value. For corporate leaders and investors, that makes the category more attractive than its absolute size alone might suggest. Growth is not driven by blind expansion, but by rigid critical care demand, deeper standardization of hospital use, and the growing indispensability of specialized therapeutic gas in advanced healthcare systems.

Figure00001. Global Inhaled Nitric Oxide Market Size (US$ Million), 2021-2032

Inhaled Nitric Oxide

Above data is based on report from QYResearch: Global Inhaled Nitric Oxide Market Report 2025-2031 (published in 2025). If you need the latest data, plaese contact QYResearch.

Demand is supported not only by patient need, but by hospital dependence on high-standard therapeutic gas supply

The most important structural driver of the iNO market is the stability of its clinical demand base. Its core established use remains concentrated in neonatal hypoxic respiratory failure and related pulmonary vascular support, giving the category a highly visible foundation of medical necessity. At the same time, neonatal persistent pulmonary hypertension remains the most important pillar supporting global demand and clearly outweighs broader exploratory uses. That concentration is highly meaningful. It shows that demand is not scattered across speculative indications, but concentrated in high-evidence, high-barrier, and high-priority clinical scenarios. Markets with that kind of demand structure are often more resilient, more profitable, and easier to defend over time. As NICU, PICU, and advanced critical care capabilities continue to improve globally, demand for high-purity, stable, and consistently supplied nitric oxide gas products is likely to remain firm.

High-purity products dominate, and specialized supply capability defines the competitive ceiling

Inhaled Nitric Oxide is not simply an extension of the industrial gases market. It is a specialty therapeutic gas segment with exceptionally demanding requirements for purity, compliance, consistency, and clinical suitability. High-purity iNO holds the dominant share of the global market, while standard-purity products account for only a small portion. This is a critical signal because it shows that competition is not primarily about who can supply gas in generic terms. It is about who can reliably provide clinically acceptable, high-quality medical gas under strict regulatory and hospital standards. In practical terms, the competitive ceiling is determined less by nominal production capacity than by compliance systems, quality assurance, purity management, cylinder supply, regional logistics, and hospital-facing commercial execution. For CEOs and marketing leaders, this is exactly what makes the market strategically attractive. It is much less vulnerable to simple low-price disruption and far more likely to concentrate value in qualified leaders.

The competitive landscape is highly concentrated, with leadership built on qualification, channels, and supply capability

The global iNO market already shows a very strong concentration profile. Major competitors are concentrated in leading companies with strong foundations in medical gases, hospital channel access, and global supply capability. Such concentration does not mean the market lacks opportunity. It means that the threshold for meaningful participation is extremely high. Products must meet medical-grade purity and registration requirements. Supply systems must be stable enough to support hospitals without interruption. In critical care, customers are highly sensitive to brand credibility, validation history, and compliance records. This makes early movers and established suppliers much harder to displace. In this sense, Inhaled Nitric Oxide is better understood as a high-regulation, high-trust, and high-fulfillment therapeutic gas market rather than a standard specialty gas category. The advantage of leaders is reflected not only in sales and revenue, but in the deep and durable trust they have built with hospital systems.

North America remains the anchor market, and regional growth depends on clinical infrastructure maturity

Regional structure further confirms the professional nature of this market. North America remains the dominant global market, followed by Europe and Asia-Pacific, while the rest of the world represents a relatively small share. This pattern is not surprising. The use of Inhaled Nitric Oxide depends heavily on mature neonatal intensive care systems, reliable hospital procurement capacity, and developed medical gas distribution networks. North America’s long-standing leadership is therefore a reflection of strong hospital infrastructure, advanced specialty care pathways, and standardized clinical use. The same logic will continue to shape future regional growth. Markets with stronger critical care systems will be better positioned to translate clinical need into real gas product demand. For Asia-Pacific and other emerging regions, opportunity will depend less on population size alone and more on specialty care expansion, hospital upgrading, and improved access to high-end therapeutic gas supply.

The supply chain is clear, and the core barrier lies not in hardware, but in therapeutic gas production and supply

Under the correct statistical boundary, the iNO supply chain should be understood in direct relation to the gas product itself. Upstream activities include nitric oxide production, medical gas raw material support, purification, cylinders and packaging systems, and related quality control. Midstream consists of the production, filling, registration, and supply of Inhaled Nitric Oxide gas products. Downstream demand comes from NICUs, PICUs, ICUs, and hospital procurement and distribution systems. In this market, the key value in the supply chain does not sit in hardware complexity, but in the ability to build a compliant, stable, continuous, and hospital-oriented commercial network for therapeutic gas. In other words, the business model is first a gas product sales model and then a scale model built on regional channels, hospital access, and long-term supply relationships. The real prize is not abstract platform ownership, but long-term share of therapeutic gas demand in high-level hospital systems.

What QYResearch highlights is not only market expansion, but the long-term value of a high-quality specialty segment

Taken together, the market size trajectory, application structure, product mix, competitive concentration, and regional distribution all point to the same conclusion. Inhaled Nitric Oxide is a classic example of a market that is moderate in size but exceptionally high in quality. It does not rely on mass-market penetration, nor is it an easily substitutable standardized category. It is a long-duration specialty market grounded in clear indications, therapeutic gas characteristics, hospital access barriers, and supply capability. For corporate leadership, it represents a strategic high ground within medical gases. For marketing executives, it is a long-term opportunity built on specialist hospital penetration and trust. For investors, it is a concentrated, resilient, and clearly structured niche with meaningful room for expansion. That is why the most important story is not only how the market grows from 2025 to 2032, but how its strategic position and long-term value within global critical care continue to be redefined.


About The Authors

Ms Zhao. Senior Analyst

Beijing Hengzhou Bozhi International Information Consulting Co.,Ltd. (QYResearch CO.,LIMITED)

Room C1501,U-Center Building,No.28 Chengfu Road, Haidian District,Beijing,100083,China

Tel:+86-15600075800 (9.00am-6.00pm UTC+8), zhaopeihong@qyresearch.com

Website: www.qyresearch.com Hot Line:4006068865

Tel:+1-6262952442(US) +81-9038009273(JP) +44-8081110143(UK)

+86-1082945717(CN) +82-1075511278(KR) +91-9766478224(IN)


About QYResearch

QYResearch founded in California, USA in 2007.It is a leading global market research and consulting company. With over 17 years’ experience and professional research team in various cities over the world QY Research focuses on management consulting, database and seminar services, IPO consulting (data is widely cited in prospectuses, annual reports and presentations), industry chain research and customized research to help our clients in providing non-linear revenue model and make them successful. We are globally recognized for our expansive portfolio of services, good corporate citizenship, and our strong commitment to sustainability. Up to now, we have cooperated with more than 60,000 clients across five continents. Let’s work closely with you and build a bold and better future.

QYResearch is a world-renowned large-scale consulting company. The industry covers various high-tech industry chain market segments, spanning the semiconductor industry chain (semiconductor equipment and parts, semiconductor materials, ICs, Foundry, packaging and testing, discrete devices, sensors, optoelectronic devices), photovoltaic industry chain (equipment, cells, modules, auxiliary material brackets, inverters, power station terminals), new energy automobile industry chain (batteries and materials, auto parts, batteries, motors, electronic control, automotive semiconductors, etc.), communication industry chain (communication system equipment, terminal equipment, electronic components, RF front-end, optical modules, 4G/5G/6G, broadband, IoT, digital economy, AI), advanced materials industry Chain (metal materials, polymer materials, ceramic materials, nano materials, etc.), machinery manufacturing industry chain (CNC machine tools, construction machinery, electrical machinery, 3C automation, industrial robots, lasers, industrial control, drones), food, beverages and pharmaceuticals, medical equipment, agriculture, etc.

About Us:
QYResearch founded in California, USA in 2007, which is a leading global market research and consulting company. Our primary business include market research reports, custom reports, commissioned research, IPO consultancy, business plans, etc. With over 18 years of experience and a dedicated research team, we are well placed to provide useful information and data for your business, and we have established offices in 7 countries (include United States, Germany, Switzerland, Japan, Korea, China and India) and business partners in over 30 countries. We have provided industrial information services to more than 60,000 companies in over the world.

Contact Us:
If you have any queries regarding this report or if you would like further information, please contact us:
QY Research Inc.
Add: 17890 Castleton Street Suite 369 City of Industry CA 91748 United States
EN: https://www.qyresearch.com
Email: global@qyresearch.com
Tel: 001-626-842-1666(US)
JP: https://www.qyresearch.co.jp

カテゴリー: 未分類 | 投稿者huangsisi 12:08 | コメントをどうぞ

Global USB Network Chip Market: Industrial vs. Consumer Grade for Personal Devices & IoT

Introduction – Core User Needs & Industry Context

Laptops, desktops, embedded systems, and IoT devices require network connectivity through USB interfaces when built-in Ethernet ports are unavailable or damaged. Traditional solutions lack efficient protocol processing and power management. USB network card chips — integrated circuits converting USB signals into Ethernet or Wi-Fi signals — solve these challenges. Core functions include interface conversion, protocol processing (IEEE 802.3/802.11), data transmission, and power management. According to the latest industry analysis, the global market for USB Network Card Chips was estimated at US$ 329 million in 2025 and is projected to reach US$ 486 million by 2032, growing at a CAGR of 5.8% from 2026 to 2032. In 2024, global sales reached 40 million units.

Global Leading Market Research Publisher QYResearch announces the release of its latest report “USB Network Card Chips – Global Market Share and Ranking, Overall Sales and Demand Forecast 2026-2032″. Based on current situation and impact historical analysis (2021-2025) and forecast calculations (2026-2032), this report provides a comprehensive analysis of the global USB Network Card Chips market, including market size, share, demand, industry development status, and forecasts for the next few years.

【Get a free sample PDF of this report (Including Full TOC, List of Tables & Figures, Chart)】
https://www.qyresearch.com/reports/6096998/usb-network-card-chips


1. Core Keyword Integration & Grade Classification

Three key concepts define the USB network card chip market: USB-to-Ethernet Interface Conversion, IEEE 802.3/802.11 Protocol Processing, and Low-Power Data Transmission. Based on application environment, chips are classified into two types:

  • Industrial Grade: Wide temperature range (-40°C to +85°C), higher reliability, longer lifespan. Used in industrial IoT, embedded systems. ~35% market share.
  • Consumer Grade: Standard temperature (0°C to +70°C), lower cost, high volume. Used in personal devices. ~65% share, largest segment.

2. Industry Layering: Personal Devices vs. Embedded vs. Industrial IoT vs. Enterprise

Aspect Personal Devices Embedded Systems Industrial & IoT Enterprise Temporary Networks
Primary application Laptops, desktops SBCs, Raspberry Pi Factory automation, sensors Temporary office, events
Key requirement Cost, plug-and-play Driver support, size Reliability, temp range Easy deployment
Preferred grade Consumer Consumer/industrial Industrial Consumer
Volume per device 1 chip 1 chip 1-2 chips Many (network cards)
Market share (2025) ~50% ~15% ~20% ~10%

Exclusive observation: The personal devices segment dominates (50% share), driven by laptop Ethernet adapter demand. The industrial & IoT segment is fastest-growing (CAGR 7%), fueled by factory automation and sensor networks.


3. Key Chip Functions & Standards

Function Description Standard
Interface conversion USB → Ethernet/Wi-Fi USB 2.0/3.0/3.1
Protocol processing Data packet handling IEEE 802.3 (Ethernet), 802.11 (Wi-Fi)
Data transmission Full-duplex/half-duplex, error correction 10/100/1000 Mbps
Power management Low-power modes, wake-on-LAN USB suspend/resume

4. Recent Data & Technical Developments (Last 6 Months)

Between Q4 2025 and Q1 2026, several advancements have reshaped the USB network card chip market:

  • USB 3.2 Gen 2 (10 Gbps) support: New chips support 10 Gbps Ethernet (vs. 1 Gbps). Adoption grew 15% in 2025.
  • USB4 integration: Thunderbolt/USB4 chips with network bridging. This segment grew 10% in 2025.
  • Low-power industrial chips: 50% lower power consumption for battery-powered IoT devices. Adoption grew 20% in 2025.
  • Policy driver – USB-IF certification (2025) : Stricter compliance requirements, benefiting established manufacturers.

User case – IT support (enterprise) : A company deployed USB network card chips for laptops without Ethernet ports. Results: enabled wired network access for security compliance, plug-and-play setup, and reduced IT support calls.

Technical challenge – Driver compatibility: USB network chips require drivers for different OS (Windows, macOS, Linux). Solutions include:

  • Vendor-provided drivers (Windows, macOS)
  • Open-source drivers (Linux kernel)
  • CDC ECM/NCM standards (native OS support)

5. Competitive Landscape & Regional Dynamics

Company Headquarters Key Strength
Realtek Taiwan Market leader; broad portfolio
Intel USA High-performance chips
Broadcom USA Enterprise and industrial
MediaTek Taiwan Wi-Fi + USB combo
ASIX Electronics Taiwan USB-to-Ethernet specialist
Nanjing Qinheng China Chinese domestic
Atheros (Qualcomm) USA Wi-Fi chips

Regional dynamics:

  • Asia-Pacific largest (60% market share), led by Taiwan (Realtek, ASIX), China (manufacturing)
  • North America second (20%), with Intel, Broadcom
  • Europe third (10%)
  • Rest of World (10%), emerging

6. Segment Analysis by Grade and Application

Segment Characteristics 2024 Share CAGR (2026-2032)
By Grade
Consumer Grade Standard temp, high volume ~65% 5.5%
Industrial Grade Wide temp, high reliability ~35% 6.5%
By Application
Personal Devices Largest ~50% 5.5%
Industrial & IoT Fastest-growing ~20% 7%
Embedded Systems Steady ~15% 6%
Enterprise Temporary Niche ~10% 5%
Others (automotive, medical) Emerging ~5% 6%

The industrial grade segment is fastest-growing (CAGR 6.5%). The industrial & IoT application leads growth (CAGR 7%).


7. Exclusive Industry Observation & Future Outlook

Why USB network card chips are essential:

Use Case Without Chip With Chip
Laptop without Ethernet port No wired network USB Ethernet adapter
Thin client/tablet Limited connectivity Network expansion
Industrial controller Proprietary interfaces Standard USB network
Temporary network Complex setup Plug-and-play

Speed evolution:

USB Generation Max Speed Ethernet Speed Chip Availability
USB 2.0 480 Mbps 100 Mbps Mature
USB 3.0 5 Gbps 1 Gbps Standard
USB 3.2 Gen 2 10 Gbps 2.5/5 Gbps Growing
USB4 40 Gbps 10 Gbps Emerging

Power consumption:

Chip Type Active Power Sleep Power Best For
Consumer 1G 300-500 mW 50-100 mW Laptops
Industrial 1G 500-800 mW 100-200 mW Factory
2.5G/5G 1-2 W 200-300 mW Gaming, pro

Key market drivers:

  • Laptop Ethernet port elimination: Thin laptops lack RJ45 ports
  • Remote work: Home office network needs
  • Industrial IoT: Wired network reliability
  • USB4 adoption: Higher speeds enabling new applications

Form factor trends:

  • USB dongles: Plug-and-play adapters
  • Embedded modules: On-board for industrial devices
  • Docking stations: Multi-port hubs with Ethernet

By 2032, the USB network card chip market is expected to exceed US$ 486 million at 5.8% CAGR.

Regional outlook:

  • Asia-Pacific largest (60%), with Taiwan design, China manufacturing
  • North America second (20%)
  • Europe third (10%)
  • Rest of World (10%), emerging

Key barriers:

  1. Driver compatibility (macOS, Linux, Windows updates)
  2. USB controller limitations (bandwidth sharing)
  3. Heat dissipation (high-speed chips)
  4. Cost pressure (commoditization)
  5. Competition from built-in Ethernet (desktops, industrial PCs)

Market nuance: The USB network card chip market is mature but growing steadily (5.8% CAGR). Consumer grade dominates (65% share); industrial fastest-growing (6.5% CAGR). Personal devices lead (50% share); industrial & IoT fastest-growing (7% CAGR). Asia-Pacific leads (60%) with Taiwan (Realtek) and China. Key trends: (1) USB 3.2 Gen 2 (10 Gbps), (2) USB4 integration, (3) low-power industrial chips, (4) USB-IF certification.


Contact Us:
If you have any queries regarding this report or if you would like further information, please contact us:
QY Research Inc.
Add: 17890 Castleton Street Suite 369 City of Industry CA 91748 United States
EN: https://www.qyresearch.com
E-mail: global@qyresearch.com
Tel: 001-626-842-1666 (US)
JP: https://www.qyresearch.co.jp

カテゴリー: 未分類 | 投稿者huangsisi 12:06 | コメントをどうぞ

In-Vehicle Projection Products: AR HUD & Smart Cockpit Displays for ADAS Integration (2026–2032)

Introduction – Core User Needs & Industry Context

Automotive manufacturers face critical challenges: traditional dashboard screens distract drivers, consume space, and cannot overlay information on the road. Drivers need navigation, speed, and warning information within their natural field of view. In-vehicle projection products — optical display systems projecting images onto windshields, instrument panels, or side windows — solve these challenges. Using DLP, LCOS, or laser projection, they create augmented reality experiences for smart cockpits and ADAS, enhancing safety, comfort, and technology appeal. According to the latest industry analysis, the global market for In-Vehicle Projection Products was estimated at US$ 8,920 million in 2025 and is projected to reach US$ 15,370 million by 2032, growing at a CAGR of 8.2% from 2026 to 2032. In 2024, global output reached 48.6 million units, with an average selling price of US$ 180 per unit.

Global Leading Market Research Publisher QYResearch announces the release of its latest report “In-Vehicle Projection Products – Global Market Share and Ranking, Overall Sales and Demand Forecast 2026-2032″. Based on current situation and impact historical analysis (2021-2025) and forecast calculations (2026-2032), this report provides a comprehensive analysis of the global In-Vehicle Projection Products market, including market size, share, demand, industry development status, and forecasts for the next few years.

【Get a free sample PDF of this report (Including Full TOC, List of Tables & Figures, Chart)】
https://www.qyresearch.com/reports/6097841/in-vehicle-projection-products


1. Core Keyword Integration & Product Classification

Three key concepts define the in-vehicle projection market: Augmented Reality Head-Up Display, Smart Cockpit Integration, and ADAS Visualization. Based on product type, in-vehicle projection products are classified into three categories:

  • HUD (Head-Up Display) : Projects onto windshield. Most common. ~60% market share.
  • Combiner HUD: Uses a separate transparent combiner. Lower cost, easier retrofit. ~25% share.
  • Others (side window projection, rear projection): Emerging applications. ~15% share.

2. Regional Market Landscape & Growth Drivers

Region Market Share Key Drivers
China ~35% NEV penetration, smart cockpit integration
Europe ~30% Luxury vehicles, safety regulations
North America ~20% Mature technology, slower adoption
Japan & South Korea ~10% Conservative adoption, strong supply chain

Exclusive observation: China leads (35% share), driven by high NEV penetration and smart cockpit capabilities. Europe (30%) follows with luxury vehicle dominance and regulatory push.


3. Technology Comparison

Technology Resolution Brightness Power Cost Best For
DLP High High Medium Medium W-HUD, AR-HUD
LCOS High Medium Low High High-resolution
Laser Very high Very high High High Premium AR-HUD

4. Recent Data & Technical Developments (Last 6 Months)

Between Q4 2025 and Q1 2026, several advancements have reshaped the in-vehicle projection market:

  • AR-HUD adoption acceleration: Augmented reality overlays (navigation arrows, collision warnings) on road. This segment grew 25% in 2025.
  • Micro-LED projection: Higher brightness (20,000+ nits), lower power. Adoption grew 15% in 2025.
  • Holographic projection: True 3D images without glasses. Emerging (5% of market).
  • Policy driver – Euro NCAP 2026: Enhanced safety ratings for ADAS visualization, accelerating AR-HUD adoption.

User case – Premium EV (China) : An EV manufacturer integrated AR-HUD (15° FOV, 20m virtual distance). Results: driver reaction time improved 30%, navigation errors reduced 50%, and customer satisfaction rated 4.8/5.

Technical challenge – Sunlight load: High-brightness projectors generate heat. Solutions include efficient Micro-LED and thermal management.


5. Competitive Landscape

Company Headquarters Key Strength
Texas Instruments USA DLP chip leader
Continental Germany System integration
Bosch Germany Tier-1 leader
Denso Japan Japanese OEM relationships
Huawei China AR-HUD technology
Futurus China AR-HUD specialist
Desay SV China Cockpit integration
Visteon USA HUD modules

Upstream supply chain:

  • Light source chips: Texas Instruments, MicroVision
  • Lasers: Osram, Nichia
  • Optical lenses: Sunny Optical, Anteryon
  • Control modules: Renesas, NXP

Downstream:

  • Passenger vehicle OEMs: Tesla, BYD, Volkswagen, Toyota
  • Commercial vehicle OEMs: Daimler, Volvo
  • Smart cockpit integrators: Huawei, Desay SV, Continental

6. Segment Analysis by Product Type and Vehicle Type

Segment Characteristics 2024 Share CAGR (2026-2032)
By Product
HUD Windshield projection ~60% 8%
Combiner HUD Separate combiner ~25% 7%
Others Emerging ~15% 10%
By Vehicle
Passenger Vehicles Largest ~85% 8%
Commercial Vehicles Growing ~10% 9%
Others (trucks, buses) Niche ~5% 8%

The others segment (side window, rear projection) is fastest-growing (CAGR 10%). The commercial vehicles application leads growth (CAGR 9%).


7. Exclusive Industry Observation & Future Outlook

Why in-vehicle projection is transforming cockpits:

Benefit Explanation
Safety Information in driver’s line of sight
Space saving No physical display needed
AR integration Overlays on real world
Immersive experience Full windshield display
Design freedom Flexible projection surfaces

HUD types comparison:

Type Image Distance FOV AR Capability Cost
C-HUD 1-2 m 5-10° No Low
W-HUD 2-3 m 10-15° Limited Medium
AR-HUD 10-20 m 15-20° Yes High

Key applications:

Feature Benefit
Navigation arrows Painted on road
Collision warning Highlight hazard vehicles
Lane departure 3D lane markers
Speed limit Overlaid on signs
POI information Floating at building location

Technology roadmap:

Generation Technology Timeframe
Current DLP, LCOS 2024-2026
Next Micro-LED 2026-2028
Future Holographic 2028-2030

Market drivers:

  • ADAS adoption: AR-HUD as visualization platform
  • EV premiumization: Differentiator for smart EVs
  • Safety regulations: Euro NCAP incentives
  • Consumer demand: Tech-savvy buyers

By 2032, the in-vehicle projection market is expected to exceed US$ 15.4 billion at 8.2% CAGR.

Regional outlook:

  • China largest (35%), with NEV leadership
  • Europe second (30%)
  • North America third (20%)
  • Japan & South Korea (10%)

Key barriers:

  1. High cost ($500-1,500 per system)
  2. Thermal management (sunlight load)
  3. Space constraints (large optical package)
  4. AR content development (software complexity)
  5. Regulatory harmonization (varies by region)

Market nuance: The in-vehicle projection market is growing strongly (8.2% CAGR), driven by AR-HUD and smart cockpit demand. HUD dominates (60% share); others fastest-growing (10% CAGR). Passenger vehicles lead (85% share); commercial vehicles fastest-growing (9% CAGR). China leads (35%). Key trends: (1) AR-HUD adoption, (2) Micro-LED projection, (3) holographic displays, (4) Euro NCAP 2026.


Contact Us:
If you have any queries regarding this report or if you would like further information, please contact us:
QY Research Inc.
Add: 17890 Castleton Street Suite 369 City of Industry CA 91748 United States
EN: https://www.qyresearch.com
E-mail: global@qyresearch.com
Tel: 001-626-842-1666 (US)
JP: https://www.qyresearch.co.jp

カテゴリー: 未分類 | 投稿者huangsisi 12:04 | コメントをどうぞ

Medical Laser Rental Service Research:compound annual growth rate (CAGR) of 11.2% in the next few years

Dental Surgical Microscope Market Summary

Dental surgical microscopes are high-magnification optical visualization systems specifically designed for oral diagnosis, dental treatment, and microsurgical procedures. They are typically equipped with a continuous zoom observation system, coaxial illumination system, surgical field focusing system, imaging and recording system, and a multidimensional support arm structure, enabling magnified observation and precise manipulation of teeth, dental pulp, root canals, periodontal tissues, and related oral soft and hard tissues under conditions of high illumination, deep depth of field, and high image clarity. These devices can significantly improve visualization of the treatment area and enhance the clinician’s ability to identify fine anatomical structures, lesion boundaries, and procedural details, thereby improving the precision, minimally invasive nature, and repeatability of treatments such as root canal therapy, microsurgical apicoectomy, periodontal surgery, implant restoration, and complex oral rehabilitation. As such, dental surgical microscopes are one of the core pieces of equipment in modern precision dentistry and microscopic oral treatment systems.

Source: Secondary Sources and QYResearch, 2026


Market Overview

In 2025, the global dental surgical microscope market reached US$ 537 million and is projected to grow to US$ 1.041 billion by 2032, representing a CAGR of 9.89% during 2025–2032. From a regional perspective, the China market has grown rapidly in recent years. In 2025, China’s market size reached US$ 67.04 million, accounting for 12.49% of the global market. By 2032, it is expected to increase to US$ 157 million, with its global share rising to 15.11%. China has already become one of the most important regions driving global demand growth for dental surgical microscopes.

Overall, the dental surgical microscope market has maintained steady expansion in recent years and has become an important niche segment within high-end dental treatment equipment. Market demand growth is mainly driven by the continuous increase in clinical requirements for precision treatment, minimally invasive procedures, and visualized diagnosis in dental practice. Especially in applications such as microscopic root canal treatment, restorative endodontics, complex retreatment, microsurgery, and certain implant restoration procedures, dental surgical microscopes can significantly improve field visibility, operational accuracy, and treatment controllability. As a result, these systems are gradually expanding from equipment once mainly used by a limited number of high-end specialty institutions to specialty clinics, large dental chains, and teaching hospitals. Dental surgical microscopes are no longer merely auxiliary tools for improving treatment outcomes, but are increasingly evolving into key equipment within high-quality dental healthcare systems.

From the perspective of market drivers, first, rising oral health awareness and consumer upgrading are jointly stimulating demand for high-quality dental treatment, while clinical attention to root canal success rates, tooth preservation rates, and postoperative patient experience continues to increase, further improving acceptance of microscopic equipment. Second, dental diagnosis and treatment are continuously moving toward digitalization, precision, and standardization. Demand from clinicians is no longer limited to optical magnification itself, but is increasingly extending to imaging documentation, case presentation, teaching and training, and dentist-patient communication. This is driving ongoing upgrades of dental surgical microscopes toward integrated cameras, digital imaging, 4K display, and case management functions. Third, growing attention is being paid to occupational health among dentists. Dental surgical microscopes offer strong value in improving posture, reducing neck, shoulder, and back fatigue, and enhancing long-term working efficiency. Their purchasing logic is therefore gradually shifting from purely improving treatment outcomes toward optimizing operating methods and overall workflow efficiency.

From a competitive perspective, the major global suppliers currently include ZEISS, Leica Microsystems, Suzhou Sometech Medical Technology Co., Ltd., Global Surgical Corporation, and Olympus Corporation. In 2025, the combined market share of the top five manufacturers exceeded 83%, indicating a relatively high level of concentration. Leading players maintain clear advantages in brand influence, optical technology, product stability, and channel networks. Over the next few years, as Chinese domestic brands continue to promote product upgrades, lower pricing, and channel expansion, market competition is expected to intensify further, with China likely to become one of the most dynamic competitive markets globally.

Overall, the global dental surgical microscope market is in an expansion stage characterized by a transition from highly specialized applications toward broader penetration across clinical scenarios, with favorable medium- to long-term development prospects. At the same time, further market expansion remains constrained by factors such as relatively high equipment prices, long physician learning curves, and limited budgets at grassroots-level institutions. Looking ahead, as the concept of microscopic dentistry becomes more widely adopted, training systems continue to improve, domestic substitution accelerates, and mid-range products gradually mature, the penetration rate of dental surgical microscopes is expected to continue increasing, and the industry as a whole is likely to maintain a solid growth trend.

Figure00002. Global Dental Surgical Microscope Market Size (US$ Million), 2025 vs 2032

Dental Surgical Microscope

Above data is based on report from QYResearch: Global Dental Surgical Microscope Market Report 2026-2032 (published in 2026). If you need the latest data, plaese contact QYResearch.

Figure00003. Global Dental Surgical Microscope Top 12 Players Ranking and Market Share (Ranking is based on the revenue of 2025, continually updated)

Dental Surgical Microscope

Above data is based on report from QYResearch: Global Dental Surgical Microscope Market Report 2026-2032 (published in 2026). If you need the latest data, plaese contact QYResearch.


According to QYResearch Top Players Research Center, the global key manufacturers of Dental Surgical Microscope include ZEISS, Leica, Zumax Medical, Global Surgical Corporation, Olympus, etc. In 2024, the global top five players had a share approximately 84.0% in terms of revenue.

Figure00004. Dental Surgical Microscope, Global Market Size, Split by Product Segment

Dental Surgical Microscope

Based on or includes research from QYResearch: Global Dental Surgical Microscope Market Report 2026-2032.


In terms of product type, currently Mobile type is the largest segment, hold a share of 74.1%.


Based on or includes research from QYResearch: Global Dental Surgical Microscope Market Report 2026-2032.


In terms of product application, currently Hospital is the largest segment, hold a share of 45.8%.


About QYResearch

QYResearch founded in California, USA in 2007.It is a leading global market research and consulting company. With over 17 years’ experience and professional research team in various cities over the world QY Research focuses on management consulting, database and seminar services, IPO consulting (data is widely cited in prospectuses, annual reports and presentations), industry chain research and customized research to help our clients in providing non-linear revenue model and make them successful. We are globally recognized for our expansive portfolio of services, good corporate citizenship, and our strong commitment to sustainability. Up to now, we have cooperated with more than 60,000 clients across five continents. Let’s work closely with you and build a bold and better future.

QYResearch is a world-renowned large-scale consulting company. The industry covers various high-tech industry chain market segments, spanning the semiconductor industry chain (semiconductor equipment and parts, semiconductor materials, ICs, Foundry, packaging and testing, discrete devices, sensors, optoelectronic devices), photovoltaic industry chain (equipment, cells, modules, auxiliary material brackets, inverters, power station terminals), new energy automobile industry chain (batteries and materials, auto parts, batteries, motors, electronic control, automotive semiconductors, etc.), communication industry chain (communication system equipment, terminal equipment, electronic components, RF front-end, optical modules, 4G/5G/6G, broadband, IoT, digital economy, AI), advanced materials industry Chain (metal materials, polymer materials, ceramic materials, nano materials, etc.), machinery manufacturing industry chain (CNC machine tools, construction machinery, electrical machinery, 3C automation, industrial robots, lasers, industrial control, drones), food, beverages and pharmaceuticals, medical equipment, agriculture, etc.

About Us:
QYResearch founded in California, USA in 2007, which is a leading global market research and consulting company. Our primary business include market research reports, custom reports, commissioned research, IPO consultancy, business plans, etc. With over 18 years of experience and a dedicated research team, we are well placed to provide useful information and data for your business, and we have established offices in 7 countries (include United States, Germany, Switzerland, Japan, Korea, China and India) and business partners in over 30 countries. We have provided industrial information services to more than 60,000 companies in over the world.

Contact Us:
If you have any queries regarding this report or if you would like further information, please contact us:
QY Research Inc.
Add: 17890 Castleton Street Suite 369 City of Industry CA 91748 United States
EN: https://www.qyresearch.com
Email: global@qyresearch.com
Tel: 001-626-842-1666(US)
JP: https://www.qyresearch.co.jp

カテゴリー: 未分類 | 投稿者huangsisi 11:58 | コメントをどうぞ

Plant Tying Machine Outlook: Labor-Saving Agricultural Tool & 6.7% CAGR to 2032

Introduction – Core User Needs & Industry Context

Farmers and gardeners growing vine crops (tomatoes, cucumbers, grapes, beans) require efficient methods to secure plants to stakes, wires, or trellises. Manual tying is labor-intensive, time-consuming, and causes hand fatigue. Plant tying machines — agricultural tools using adhesive tape and staples (or electric binding wire/tape) for automatic or semi-automatic tying — solve these challenges. They significantly improve efficiency, reduce labor intensity, and ensure plants are well-supported and neatly arranged during growth. According to the latest industry analysis, the global market for Plant Tying Machines was estimated at US$ 308 million in 2025 and is projected to reach US$ 482 million by 2032, growing at a CAGR of 6.7% from 2026 to 2032. In 2024, global production reached 3.54 million units.

Global Leading Market Research Publisher QYResearch announces the release of its latest report “Plant Tying Machine – Global Market Share and Ranking, Overall Sales and Demand Forecast 2026-2032″. Based on current situation and impact historical analysis (2021-2025) and forecast calculations (2026-2032), this report provides a comprehensive analysis of the global Plant Tying Machine market, including market size, share, demand, industry development status, and forecasts for the next few years.

【Get a free sample PDF of this report (Including Full TOC, List of Tables & Figures, Chart)】
https://www.qyresearch.com/reports/6097801/plant-tying-machine


1. Core Keyword Integration & Power Source Classification

Three key concepts define the plant tying machine market: Automatic Plant Binding, Labor-Saving Agricultural Tool, and Vine Crop Support System. Based on power source, tying machines are classified into three types:

  • Manual Type: Hand-operated, trigger mechanism. Lowest cost, suitable for small gardens. ~45% market share.
  • Electric Type: Battery-powered, semi-automatic. Most common for commercial use. ~40% share, fastest-growing.
  • Pneumatic Type: Air compressor powered. High volume, commercial greenhouses. ~15% share.

2. Industry Layering: Commercial vs. Household Use – Divergent Requirements

Aspect Commercial Use Household Use
Primary user Farms, greenhouses, vineyards Home gardeners
Key requirement Speed, durability, volume Ease of use, affordability
Preferred type Electric or pneumatic Manual
Typical tying speed 1-2 seconds per plant 3-5 seconds per plant
Battery life requirement 8-10 hours 1-2 hours
Market share (2025) ~70% ~25%

Exclusive observation: The commercial use segment dominates (70% share), driven by large-scale greenhouse and vineyard operations. The household segment is growing with home gardening trends.


3. Key Features & Applications

Crop Tying Frequency Machine Benefit
Tomatoes Weekly during growth Reduces labor 80%
Cucumbers Every 3-5 days Consistent support
Grapes Seasonally Fast vineyard work
Beans Once per season Neat row arrangement
Peppers As needed Prevents breakage

4. Recent Data & Technical Developments (Last 6 Months)

Between Q4 2025 and Q1 2026, several advancements have reshaped the plant tying machine market:

  • Battery-powered electric models: Lithium-ion batteries (2-4 Ah) provide 8-10 hours of operation. This segment grew 20% in 2025.
  • Biodegradable tape options: Environmentally friendly tape for organic farming. Adoption grew 15% in 2025.
  • Ergonomic designs: Reduced weight (0.8-1.2 kg) and improved grip for less hand fatigue. This segment grew 10% in 2025.
  • Policy driver – Agricultural labor shortage (2025) : Labor costs rising globally, accelerating mechanization of tying tasks.

User case – Commercial tomato greenhouse (Europe) : A 10-acre greenhouse switched from manual to electric plant tying machines. Results: tying time reduced from 4 hours to 45 minutes per 1,000 plants, labor costs reduced 70%, and plant damage reduced 50%.

Technical challenge – Tape jamming: Poor-quality tape causes machine jams. Solutions include:

  • Precision-cut tape (consistent width)
  • Automatic jam detection
  • Quick-release mechanisms (clearing jams in seconds)

5. Competitive Landscape & Regional Dynamics

Company Headquarters Key Strength
Infaco France Professional tying machines
Pellenc France Electric and pneumatic specialist
MAX Japan Manual tying tools
Zenport USA Value segment
Swansoft China Chinese domestic leader
Jacto Brazil Latin American market
GROWNEER China Entry-level electric

Regional dynamics:

  • Asia-Pacific largest (45% market share), led by China (manufacturing, vegetable production), Japan, India
  • Europe second (25%), with France (Infaco, Pellenc)
  • North America third (15%), with commercial greenhouses
  • Rest of World (15%), emerging (Latin America)

6. Segment Analysis by Power Type and Use Case

Segment Characteristics 2024 Share CAGR (2026-2032)
By Power Type
Manual Low cost, basic ~45% 5.5%
Electric Battery-powered ~40% 8%
Pneumatic High volume ~15% 6%
By Use Case
Commercial Farms, greenhouses ~70% 7%
Household Home gardens ~25% 6%
Others (nurseries) Niche ~5% 6.5%

The electric type segment is fastest-growing (CAGR 8%). The commercial use case leads growth (CAGR 7%).


7. Exclusive Industry Observation & Future Outlook

Why plant tying machines are essential:

Problem Manual Tying Machine Tying
Time per 1,000 plants 4-8 hours 30-60 minutes
Labor cost per season High 70-80% lower
Hand fatigue Significant Minimal
Consistency Variable Uniform
Plant damage Moderate Low

Tying speed comparison:

Machine Type Plants per hour Operator fatigue
Manual 150-250 High
Electric 500-800 Low
Pneumatic 800-1,200 Low

Tape/staple consumption:

Operation Scale Tapes per season Staples per season
Home garden (100 plants) 200-300 200-300
Commercial greenhouse (10,000 plants) 20,000-30,000 20,000-30,000

Battery life comparison:

Battery Type Capacity Operating Time Charge Time
NiMH 1.5-2 Ah 2-3 hours 3-4 hours
Li-ion (standard) 2-3 Ah 4-6 hours 2-3 hours
Li-ion (high capacity) 4-5 Ah 8-10 hours 3-4 hours

Key market drivers:

  • Labor shortages: Rising agricultural labor costs
  • Greenhouse expansion: Protected cultivation growth
  • Organic farming: Biodegradable tape demand
  • Small farm mechanization: Affordable electric models

Future trends:

  • Automatic height adjustment: Sensors for plant growth
  • Smart tying: Integration with farm management systems
  • Battery technology: Longer life, faster charging
  • Biodegradable consumables: Eco-friendly tapes

By 2032, the plant tying machine market is expected to exceed US$ 482 million at 6.7% CAGR.

Regional outlook:

  • Asia-Pacific largest (45%), with China production
  • Europe second (25%)
  • North America third (15%)
  • Rest of World (15%), emerging

Key barriers:

  1. Initial cost ($50-300 for electric models)
  2. Tape/staples consumables (ongoing cost)
  3. Learning curve (proper technique required)
  4. Maintenance (cleaning, tape jams)
  5. Battery life (for large operations)

Market nuance: The plant tying machine market is growing steadily (6.7% CAGR), driven by labor shortages and greenhouse expansion. Manual type dominates (45% share); electric fastest-growing (8% CAGR). Commercial use dominates (70% share). Asia-Pacific leads (45%) with China production. Key trends: (1) electric battery models, (2) biodegradable tape, (3) ergonomic designs, (4) agricultural labor shortages.


Contact Us:
If you have any queries regarding this report or if you would like further information, please contact us:
QY Research Inc.
Add: 17890 Castleton Street Suite 369 City of Industry CA 91748 United States
EN: https://www.qyresearch.com
E-mail: global@qyresearch.com
Tel: 001-626-842-1666 (US)
JP: https://www.qyresearch.co.jp

カテゴリー: 未分類 | 投稿者huangsisi 11:57 | コメントをどうぞ

Global Aluminium Top Case Market: 30L-50L Capacity for Motorcycles & Electric Bikes

Introduction – Core User Needs & Industry Context

Long-distance touring and adventure riders require durable, secure storage that withstands demanding road conditions. Plastic top cases may crack under stress or UV exposure. Aluminium motorcycle top cases — rear-mounted storage units made primarily from aluminium alloy — solve these challenges. They offer reduced weight, corrosion resistance, and enhanced durability, with waterproof sealing and reinforced locking mechanisms. Compared to plastic, aluminium versions provide superior robustness and safety for long-distance touring and adventure riding. According to the latest industry analysis, the global market for Aluminium Motorcycle Top Cases was estimated at US$ 205 million in 2025 and is projected to reach US$ 297 million by 2032, growing at a CAGR of 5.5% from 2026 to 2032. Global sales in 2024 reached 2.05 million units, with an average price of US$ 95 per unit.

Global Leading Market Research Publisher QYResearch announces the release of its latest report “Aluminium Motorcycle Top Cases – Global Market Share and Ranking, Overall Sales and Demand Forecast 2026-2032″. Based on current situation and impact historical analysis (2021-2025) and forecast calculations (2026-2032), this report provides a comprehensive analysis of the global Aluminium Motorcycle Top Cases market, including market size, share, demand, industry development status, and forecasts for the next few years.

【Get a free sample PDF of this report (Including Full TOC, List of Tables & Figures, Chart)】
https://www.qyresearch.com/reports/6097783/aluminium-motorcycle-top-cases


1. Core Keyword Integration & Capacity Classification

Three key concepts define the aluminium top case market: Lightweight Aluminium Alloy Construction, Corrosion-Resistant Touring Storage, and Reinforced Locking Security. Based on storage capacity, top cases are classified into four types:

  • Below 30L: Small, for daily essentials. ~25% market share.
  • 30–40L: Standard for commuting. Largest segment. ~35% share.
  • 41–50L: Medium for touring. ~25% share.
  • Above 50L: Large for long-distance touring. ~15% share.

2. Regional Market Landscape

Region Market Share Key Drivers
Asia ~42% Large two-wheeler base, commuting demand
Europe ~28% Premium touring, adventure riding
Latin America ~18% Delivery services, daily transportation
North America ~12% Leisure, cruiser models

Exclusive observation: Asia dominates (42% share), driven by large motorcycle and scooter populations. Europe (28%) has highest ASP due to premium touring and adventure brands.


3. Aluminium vs. Plastic Top Cases

Feature Plastic Top Case Aluminium Top Case
Weight Lighter Slightly heavier (but lightweight alloy)
Durability Moderate Excellent
Impact resistance Cracks under stress Dents but maintains integrity
UV resistance Degrades over time Excellent
Corrosion resistance Good Excellent
Security Moderate High (reinforced locks)
Cost Lower Higher
Best for Commuting, casual Touring, adventure, off-road

4. Recent Data & Technical Developments (Last 6 Months)

Between Q4 2025 and Q1 2026, several advancements have reshaped the aluminium top case market:

  • Lightweight aluminium alloys: 6000-series alloys reduce weight by 15-20% vs. traditional. This segment grew 15% in 2025.
  • Smart locking systems: Bluetooth-enabled locks with smartphone control and theft alarms. Adoption grew 20% in 2025.
  • Quick-release mechanisms: Tool-free mounting/removal in seconds. This segment grew 10% in 2025.
  • IoT-enabled cases: GPS tracking, remote access, theft alerts (emerging). This segment grew 25% in 2025.

User case – Adventure tourer (Europe) : A rider equipped a BMW GS with 50L aluminium top case for a 5,000km off-road tour. Results: waterproof in heavy rain, survived drops without cracking, and secure locking for gear storage.

Technical challenge – Weight vs. durability trade-off: Thinner aluminium saves weight but reduces impact resistance. Solutions include reinforced corners and internal bracing.


5. Competitive Landscape

The motorcycle top case industry is dominated by international brands with strong OEM partnerships and distribution channels.

Company Headquarters Key Strength
GIVI Italy Global leader; touring specialist
SHAD Spain Quick-release systems
KAPPA Italy Value segment
Oxford Products UK Accessories
Viking Bags USA Cruiser/touring
HOLAN China Asian market

Supply chain:

  • Upstream: Aluminium alloy suppliers, metal locking systems, waterproof seals
  • Downstream: Motorcycle manufacturers, aftermarket retailers

Brand concentration: High brand concentration (GIVI, SHAD, Kappa dominate), with diversified regional supply chains.


6. Segment Analysis by Capacity and Vehicle Type

Segment Characteristics 2024 Share CAGR (2026-2032)
By Capacity
Below 30L Small, daily ~25% 5%
30-40L Standard commuting ~35% 5.5%
41-50L Medium touring ~25% 6%
Above 50L Large touring ~15% 6%
By Vehicle
Motorcycle Mainstream ~85% 5.5%
Electric Bike Growing ~10% 7%
Other (scooters) Niche ~5% 5%

The large capacity segments (41-50L, above 50L) are fastest-growing (CAGR 6%). The electric bike application leads growth (CAGR 7%).


7. Exclusive Industry Observation & Future Outlook

Why aluminium top cases for touring:

Benefit Explanation
Durability Withstands drops, impacts
Waterproof Sealed against rain
Security Reinforced locks
UV resistance No fading or cracking
Corrosion resistance Ideal for coastal areas

Aluminium alloy grades:

Grade Strength Corrosion Resistance Weight Cost Use
5052 Moderate Excellent Light Medium Standard
6061 Good Good Light Medium Premium
6063 Moderate Good Light Low Entry

Capacity recommendations:

Riding Style Recommended Capacity Typical Contents
Daily commuting 30-40L Helmet, rain gear
Weekend touring 41-50L Clothing, tools, camera
Long-distance touring 50L+ Camping gear, multiple days

Technology trends:

Trend Description
Smart locking Bluetooth, smartphone control
IoT integration GPS tracking, theft alerts
Quick-release Tool-free mounting
Integrated lighting LED brake lights
Lightweight alloys 6000-series, carbon composites

Delivery service impact: Expansion of food delivery services drives demand for durable, lockable top cases for delivery bags.

Future outlook:

  • Smart technologies: IoT-enabled cases with remote access
  • Customization: Color-matching, modular designs
  • Lightweight solutions: Advanced aluminium alloys
  • Regional penetration: Emerging markets (India, Southeast Asia)

By 2032, the aluminium top case market is expected to exceed US$ 297 million at 5.5% CAGR.

Regional outlook:

  • Asia largest (42%), with two-wheeler base
  • Europe second (28%)
  • Latin America third (18%)
  • North America fourth (12%)

Key barriers:

  1. Higher cost (2-3x plastic cases)
  2. Weight (heavier than plastic)
  3. Aesthetics (some riders prefer plastic styling)
  4. Theft concerns (targeted for resale value)
  5. Compatibility issues (specific mounting systems)

Market nuance: The aluminium top case market is growing steadily (5.5% CAGR), driven by touring and adventure riding. 30-40L capacity dominates (35% share); large capacities (41-50L, 50L+) fastest-growing (6% CAGR). Motorcycles dominate (85% share); electric bikes fastest-growing (7% CAGR). Asia leads (42%). Key trends: (1) lightweight alloys, (2) smart locking systems, (3) quick-release mechanisms, (4) IoT integration.


Contact Us:
If you have any queries regarding this report or if you would like further information, please contact us:
QY Research Inc.
Add: 17890 Castleton Street Suite 369 City of Industry CA 91748 United States
EN: https://www.qyresearch.com
E-mail: global@qyresearch.com
Tel: 001-626-842-1666 (US)
JP: https://www.qyresearch.co.jp

カテゴリー: 未分類 | 投稿者huangsisi 11:49 | コメントをどうぞ

Global Projector Lens Market: Short-Throw vs. Ultra-Short-Throw for Education & Home Theater

Introduction – Core User Needs & Industry Context

Projection systems for education, business, cinema, and home theater require lenses that deliver clear, uniform, color-accurate images. Lens design must balance optical performance, thermal stability, mechanical strength, and cost. High-brightness projection demands excellent heat and deformation resistance. Projector lenses — core optical components focusing image beams from light sources onto screens — solve these challenges. They consist of multiple optical lens elements (glass or resin), controlling focal length, aperture, field of view, and distortion. According to the latest industry analysis, the global market for Projector Lenses was estimated at US$ 1,710 million in 2025 and is projected to reach US$ 2,573 million by 2032, growing at a CAGR of 6.1% from 2026 to 2032. In 2024, global production reached 11.18 million units, with an average selling price of US$ 150 per unit.

Global Leading Market Research Publisher QYResearch announces the release of its latest report “Projector Lens – Global Market Share and Ranking, Overall Sales and Demand Forecast 2026-2032″. Based on current situation and impact historical analysis (2021-2025) and forecast calculations (2026-2032), this report provides a comprehensive analysis of the global Projector Lens market, including market size, share, demand, industry development status, and forecasts for the next few years.

【Get a free sample PDF of this report (Including Full TOC, List of Tables & Figures, Chart)】
https://www.qyresearch.com/reports/6097764/projector-lens


1. Core Keyword Integration & Lens Type Classification

Three key concepts define the projector lens market: Short-Throw Projection Optics, Ultra-Short-Throw Lens Design, and High-Brightness Thermal Stability. Based on throw ratio (distance to screen vs. image width), projector lenses are classified into four types:

  • Short-Throw Lens: Throw ratio 0.4-1.0. Projects large image from short distance. ~35% market share.
  • Ultra-Short-Throw (UST) Lens: Throw ratio 0.19-0.4. Projects from inches from wall. ~25% share, fastest-growing.
  • Telephoto Lens: Long throw ratio >1.5. For large venues, rear projection. ~20% share.
  • Others (zoom, fixed, anamorphic): Specialty applications. ~20% share.

2. Industry Layering: Commercial/Engineering vs. Education vs. Home Theater – Divergent Requirements

Aspect Commercial & Engineering Education & Training Home Theater
Primary application Cinema, simulation, signage Classroom, lecture hall Premium home cinema
Key requirement High brightness, long throw Durability, cost Color accuracy, contrast
Preferred lens type Telephoto, zoom Short-throw Ultra-short-throw
Typical throw ratio 1.5-5.0 0.4-0.8 0.19-0.4
Market share (2025) ~35% ~30% ~25%

Exclusive observation: The commercial & engineering segment dominates (35% share), driven by cinema and large-venue projection. The home theater segment is fastest-growing (CAGR 7.5%), fueled by 4K laser TV adoption.


3. Projection Technologies & Lens Requirements

Technology Light Source Lens Requirement Typical Application
DLP Lamp, LED, laser High contrast, fast switching Business, cinema, portable
LCD Lamp, LED Color uniformity Education, business
LCOS Laser High resolution, color accuracy Home theater, cinema
Laser Laser Heat resistance, AR coatings High-end all

4. Recent Data & Technical Developments (Last 6 Months)

Between Q4 2025 and Q1 2026, several advancements have reshaped the projector lens market:

  • Ultra-short-throw (UST) growth: 0.19-0.25 throw ratio for 4K laser TV. This segment grew 20% in 2025.
  • All-glass lens dominance: High-end lenses use precision-ground optical glass (vs. resin) for heat resistance. This segment grew 15% in 2025.
  • Anti-reflective (AR) coating improvements: Multi-layer coatings reduce reflection from 2% to <0.2% per surface. Adoption grew 10% in 2025.
  • Policy driver – Digital cinema 4K upgrade (2025) : Cinema chain upgrades driving demand for high-resolution lenses.

User case – Laser TV (home theater) : A consumer purchased an ultra-short-throw laser projector with 0.19 throw ratio lens. Results: 120″ image from 9 inches from wall, 4K resolution, and ambient light rejection.

Technical challenge – Thermal lensing: Heat from high-brightness light sources causes glass expansion, shifting focus. Solutions include thermally compensated designs, active cooling, and low-expansion glass materials.


5. Supply Chain & Competitive Landscape

Upstream supply chain:

  • Optical glass: SCHOTT (Germany), Ohara (Japan)
  • Coating materials: Materion (USA), Zhongke Coating (China)
  • Lens processing equipment: Satisloh, LOH (Germany)
  • Lens barrel components: Precision injection molding, CNC machining

Downstream OEMs:

  • Consumer/professional: Epson, BenQ, Optoma, ViewSonic
  • Industrial: Bosch, Keyence, Hikvision
  • Medical imaging: GE Healthcare, Philips Healthcare
  • Education: Hony, Seewo, MAXHUB

Lens manufacturers:

Company Headquarters Key Strength
Zeiss Germany Premium optical glass
Leica Germany High-end cinema lenses
Canon Japan Broad projector lens portfolio
Nikon Japan Precision optics
Fujifilm Japan Medical imaging lenses
Konica Minolta Japan Projection optics
Tamron Japan Third-party lenses
Largan Taiwan High-volume manufacturing
BenQ Taiwan Projector manufacturer + lenses

Regional dynamics:

  • Asia-Pacific largest (50% market share), led by Japan (Canon, Nikon, Fujifilm), Taiwan (Largan, BenQ), China
  • Europe second (25%), with Germany (Zeiss, Leica)
  • North America third (15%), with professional AV
  • Rest of World (10%), emerging

6. Segment Analysis by Lens Type and Application

Segment Characteristics 2024 Share CAGR (2026-2032)
By Lens Type
Short-Throw Education, business ~35% 6%
Ultra-Short-Throw Home theater, laser TV ~25% 7.5%
Telephoto Cinema, large venue ~20% 5.5%
Others Zoom, anamorphic ~20% 6%
By Application
Commercial/Engineering Largest ~35% 6%
Education/Training Steady ~30% 5.5%
Home Theater Fastest-growing ~25% 7.5%
Others (medical, simulation) Niche ~10% 6%

The ultra-short-throw segment is fastest-growing (CAGR 7.5%). The home theater application leads growth (CAGR 7.5%).


7. Exclusive Industry Observation & Future Outlook

Why lens quality matters for projection:

Lens Defect Impact
Chromatic aberration Color fringing at edges
Distortion Straight lines appear curved
Field curvature Edges out of focus
Low contrast Washed-out image
Vignetting Dark corners

Key optical parameters:

Parameter Description Typical Range
Focal length Distance to image plane 10-100mm
Aperture (f-number) Light gathering f/1.7 – f/3.5
Throw ratio Distance/image width 0.19-5.0
Field of view Image coverage 30°-120°

Lens element types:

Element Function
Convex Focuses light
Concave Diverges light
Meniscus Corrects aberration
Aspheric Reduces spherical aberration

Coating technologies:

Coating Reflection per surface Application
Uncoated 4% Basic
Single-layer AR 1.5% Standard
Multi-layer AR <0.5% Premium
Broadband AR <0.2% High-end cinema

Resolution evolution:

Year Resolution Lens Requirement
2020 2K Standard glass
2024 4K Low-dispersion glass
2026 8K Advanced multi-group
2030 16K Ultra-precision optics

Lens manufacturing process:

  1. Glass blank molding
  2. Precision grinding
  3. Polishing
  4. Coating
  5. Centering and edging
  6. Assembly and alignment

By 2032, the projector lens market is expected to exceed US$ 2.57 billion at 6.1% CAGR.

Regional outlook:

  • Asia-Pacific largest (50%), with Japan, Taiwan manufacturing
  • Europe second (25%)
  • North America third (15%)
  • Rest of World (10%), emerging

Key barriers:

  1. High manufacturing cost (precision grinding, coating)
  2. Thermal management (heat from high-brightness sources)
  3. Competition from resin lenses (consumer segments)
  4. Technical expertise required (optical design)
  5. Long lead times (custom lens production)

Market nuance: The projector lens market is growing steadily (6.1% CAGR), driven by 4K/8K and UST laser TV. Short-throw dominates (35% share); ultra-short-throw fastest-growing (7.5% CAGR). Commercial/engineering leads (35% share); home theater fastest-growing (7.5% CAGR). Asia-Pacific leads (50%) with Japan/Taiwan manufacturing. Key trends: (1) ultra-short-throw growth, (2) all-glass lens dominance, (3) AR coating improvements, (4) 4K/8K cinema upgrades.


Contact Us:
If you have any queries regarding this report or if you would like further information, please contact us:
QY Research Inc.
Add: 17890 Castleton Street Suite 369 City of Industry CA 91748 United States
EN: https://www.qyresearch.com
E-mail: global@qyresearch.com
Tel: 001-626-842-1666 (US)
JP: https://www.qyresearch.co.jp

カテゴリー: 未分類 | 投稿者huangsisi 11:47 | コメントをどうぞ