Semiconductor Cigar Humidor Market Summary
A semiconductor cigar humidor is a storage device using thermoelectric cooling technology. By passing an electric current through semiconductor materials to create a temperature difference, it precisely controls temperature. With features like vibration-free operation, low noise, and environmental friendliness, it preserves cigars’ quality and flavor.
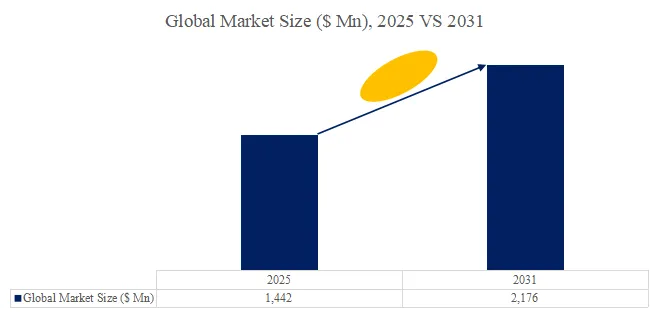
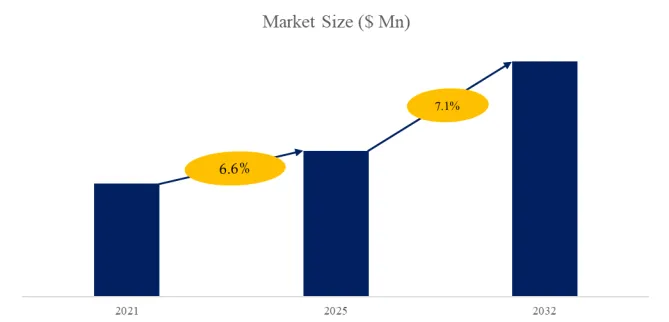
According to the new market research report “Global Semiconductor Cigar Humidor Market Report 2026-2032”, published by QYResearch, the global Semiconductor Cigar Humidor market size is projected to reach USD 41.5 million by 2032, at a CAGR of 3.9% during the forecast period.
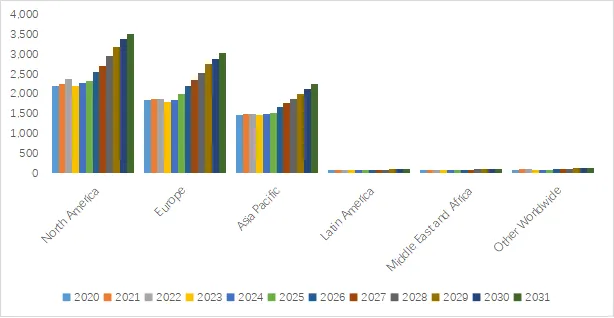
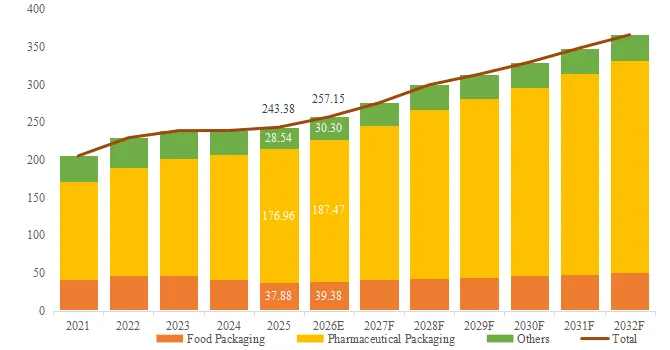
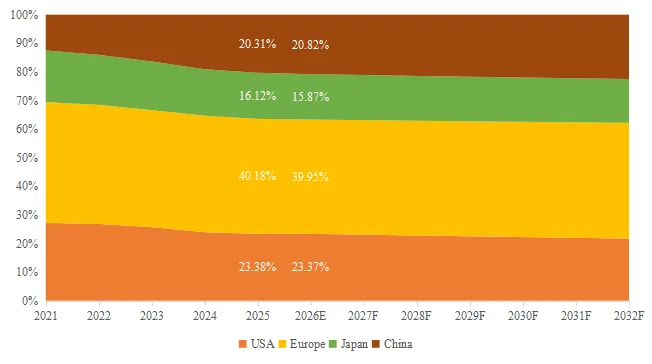
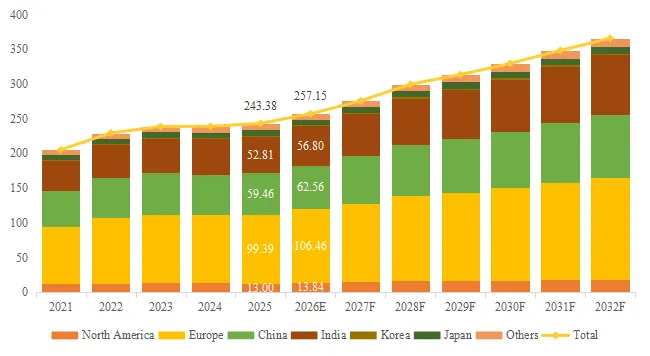
Figure00001. Global Semiconductor Cigar Humidor Market Size (US$ Million), 2021-2032
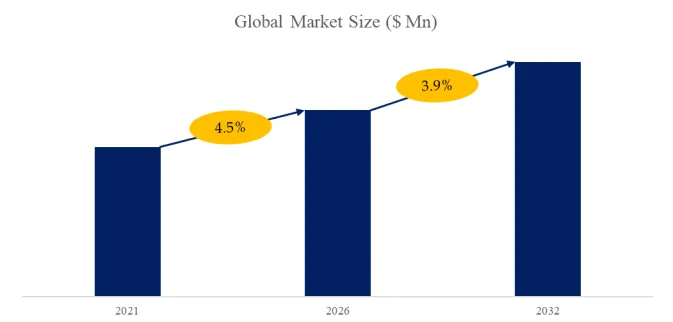
Above data is based on report from QYResearch: Global Semiconductor Cigar Humidor Market Report 2026-2032 (published in 2026). If you need the latest data, plaese contact QYResearch.
1. Market Trends
Trend 1: Evolution from functional integration to intelligent semiconductor cooling systems
Mainstream products are upgrading from basic electronic temperature control to precision environmental systems centered on thermoelectric cooling (TEC). The trend is shifting from single cooling functions to integrated platforms combining temperature, humidity, airflow, and VOC sensing with closed-loop control. By leveraging the thermoelectric effect alongside fuzzy logic and PID control, advanced cabinets deliver compressor-free, vibration-free, and refrigerant-free microenvironment simulation with high precision, meeting long-term aging requirements of premium cigars. This reflects a broader transition from conventional refrigeration appliances to precision environmental equipment.
Trend 2: Upgrade from storage devices to IoT-enabled consumer terminals
With the penetration of IoT technologies, cigar cabinets are evolving into intelligent terminals that connect users with lifestyle ecosystems. Key trends include remote monitoring, data visualization, and cloud-based services. Integrated sensors and wireless modules enable real-time environmental tracking, while advanced applications incorporate blockchain for provenance tracking of rare cigars, shifting from simple storage to digital asset management and enhancing brand-consumer interaction.
Trend 3: Younger and more segmented consumer demographics
The global cigar consumption landscape is becoming younger and more diversified, extending beyond traditional affluent male users to younger professionals and female enthusiasts. This shift drives demand for compact, portable products as well as customized cabinets with strong aesthetic and social attributes. Product development increasingly balances technical performance with design and cultural positioning.
2. Market Drivers
Driver 1: Asset-oriented preservation demand in the premium segment
As interest in alternative investments grows, aged cigars are increasingly viewed as consumable assets. Their value lies in both consumption and appreciation through aging. Semiconductor cigar cabinets provide the precise environmental control required for long-term preservation, supporting this asset-oriented demand and driving growth in high-end storage equipment.
Driver 2: Maturity and cost optimization of thermoelectric technology
Advancements in thermoelectric cooling technology are a core driver. Compared with compressor-based systems, TEC solutions offer advantages in miniaturization, silent operation, vibration-free performance, precise temperature control (up to ±0.1°C), and environmental friendliness. As upstream components such as thermoelectric modules, heat dissipation systems, and insulation materials become more cost-effective, manufacturers can deliver high-performance solutions at competitive prices, accelerating substitution of traditional storage devices.
Driver 3: Channel transformation and experiential marketing
Market expansion is also driven by evolving sales channels. Traditional appliance retail is being supplemented by partnerships with premium lifestyle venues such as luxury hotels, private clubs, and duty-free stores. Embedding products into real-life usage scenarios enhances consumer understanding and reduces education costs, improving conversion rates and brand value.
3. Market Restraints
Restraint 1: Lack of industry standards and trust issues
The absence of unified technical standards and certification systems has led to inconsistent product quality. Misleading specifications and poor performance in low-end products undermine consumer trust, prolong purchase decisions, and hinder healthy market development.
Restraint 2: Macroeconomic pressure on discretionary spending
As non-essential luxury products, cigar cabinets are highly sensitive to economic conditions. Slower growth, geopolitical risks, and inflation can weaken consumer confidence and reduce spending on high-value durable goods, limiting market expansion.
Restraint 3: Cross-cultural perception gaps and regulatory barriers
In emerging markets, awareness of professional cigar storage remains limited, leading to confusion with simpler alternatives. Additionally, complex regulations related to tobacco products, energy efficiency, and safety standards create barriers to market entry and increase compliance costs for global players.
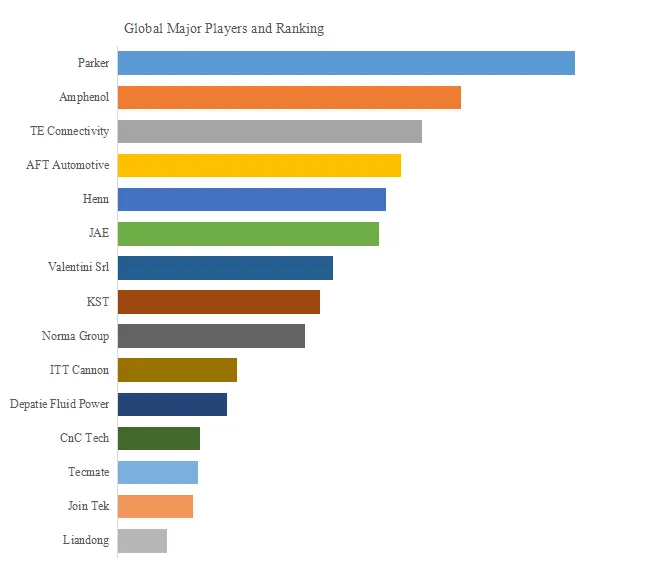
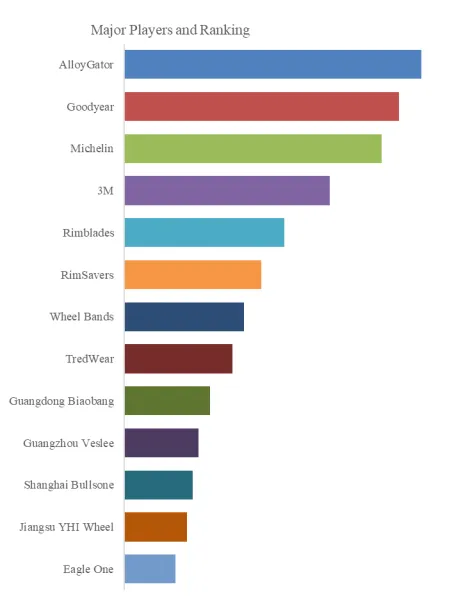
Figure00002. Global Semiconductor Cigar Humidor Top 5 Players Ranking and Market Share (Ranking is based on the revenue of 2025, by revenue, continually updated)
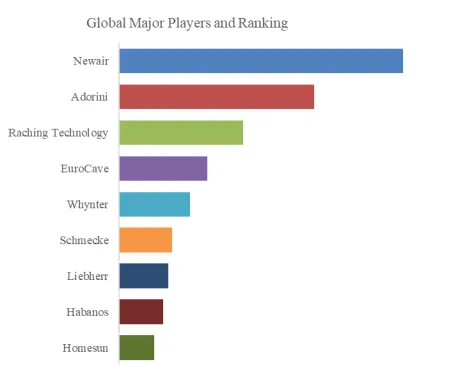
Above data is based on report from QYResearch: Global Semiconductor Cigar Humidor Market Report 2026-2032 (published in 2026). If you need the latest data, plaese contact QYResearch.
According to QYResearch Top Players Research Center, the global key manufacturers of Semiconductor Cigar Humidor include Newair, Adorini, Raching Technology, EuroCave, Whynter, etc. In 2025, the global top five players had a share approximately 34% in terms of revenue.
Major Players Profiles:
Newair
Founded in 2001 and headquartered in California, USA, Newair is a leading provider of compact household appliances and specialized cooling solutions in North America. The company’s core business revolves around built-in and freestanding precision appliances, with its electric cigar humidor line (Newair Wineadors) gaining significant market share through competitive pricing and modern industrial design. Newair’s products integrate advanced thermoelectric cooling technology and precise hygrometers to ensure optimal storage environments. Dedicated to making professional-grade storage accessible, the company caters to both novices and aficionados, establishing itself as a dominant force in the global retail and consumer-grade cigar preservation market.
Adorini
Adorini is a globally recognized German specialist in cigar accessories and humidification systems. Since its inception in 1999, the brand has built a prestigious reputation by blending rigorous German engineering with sophisticated aesthetic design. Its business scope spans from artisanal humidors to large-scale electronic cigar cabinets, with a core competitive advantage centered on its proprietary humidification technology. Adorini’s electric cabinets emphasize long-term material stability and uniform airflow circulation, utilizing precise electronic control systems to ensure the aging quality of premium cigars. Distributed in numerous countries, Adorini stands as a benchmark brand for professional cigar collectors and connoisseurs across Europe and international markets.
Raching Technology
Shenzhen Raching Technology Co., Ltd., founded in 2004 and headquartered in Shenzhen, China, is a premier global provider of constant temperature and humidity storage solutions. As a high-tech enterprise, Raching maintains a significant technological lead in the electric cigar humidor sector, specializing in the R&D and manufacturing of smart, solid-wood cabinets. Its core business integrates IoT technology and advanced ultrasonic humidification to simulate ideal cellar environments, featuring APP remote monitoring and automated water-filling systems. Leveraging superior craftsmanship and supply chain efficiencies, Raching has become a world leader in production and sales volume, serving high-end clubs and private collectors globally with innovative, intelligent preservation solutions.
EuroCave
Created in 1976 in France, EuroCave is a global pioneer and luxury brand in professional wine and cigar storage. As a standard-bearer for “Origine France Garantie,” the company focuses on utilizing biomimetic technology to replicate natural cellar environments. EuroCave’s electric cigar humidor business targets the high-end luxury market, featuring unique temperature and humidity compensation systems designed for the long-term maturation of premium cigars. Their products are regarded not just as storage units, but as masterpieces combining artistic aesthetics with precision science. Through an international network of specialized distributors, EuroCave serves the world’s finest hotels, restaurants, and private clients who demand the ultimate standards in preservation technology.
About The Authors
| Zhang Xuelu – Analyst for this report | |
| Email: zhangxuelu@qyresearch.com
|
|
| Website: www.qyresearch.com Hot Line:4006068865
QYResearch focus on Market Survey and Research US: +1-888-365-4458(US) +1-202-499-1434(Int’L) EU: +44-808-111-0143(UK) +44-203-734-8135(EU) Asia: +86-10-8294-5717(CN) +852-30628839(HK) |
About QYResearch
QYResearch founded in California, USA in 2007.It is a leading global market research and consulting company. With over 17 years’ experience and professional research team in various cities over the world QY Research focuses on management consulting, database and seminar services, IPO consulting (data is widely cited in prospectuses, annual reports and presentations), industry chain research and customized research to help our clients in providing non-linear revenue model and make them successful. We are globally recognized for our expansive portfolio of services, good corporate citizenship, and our strong commitment to sustainability. Up to now, we have cooperated with more than 60,000 clients across five continents. Let’s work closely with you and build a bold and better future.
QYResearch is a world-renowned large-scale consulting company. The industry covers various high-tech industry chain market segments, spanning the semiconductor industry chain (semiconductor equipment and parts, semiconductor materials, ICs, Foundry, packaging and testing, discrete devices, sensors, optoelectronic devices), photovoltaic industry chain (equipment, cells, modules, auxiliary material brackets, inverters, power station terminals), new energy automobile industry chain (batteries and materials, auto parts, batteries, motors, electronic control, automotive semiconductors, etc.), communication industry chain (communication system equipment, terminal equipment, electronic components, RF front-end, optical modules, 4G/5G/6G, broadband, IoT, digital economy, AI), advanced materials industry Chain (metal materials, polymer materials, ceramic materials, nano materials, etc.), machinery manufacturing industry chain (CNC machine tools, construction machinery, electrical machinery, 3C automation, industrial robots, lasers, industrial control, drones), food, beverages and pharmaceuticals, medical equipment, agriculture, etc.
About Us:
QYResearch founded in California, USA in 2007, which is a leading global market research and consulting company. Our primary business include market research reports, custom reports, commissioned research, IPO consultancy, business plans, etc. With over 18 years of experience and a dedicated research team, we are well placed to provide useful information and data for your business, and we have established offices in 7 countries (include United States, Germany, Switzerland, Japan, Korea, China and India) and business partners in over 30 countries. We have provided industrial information services to more than 60,000 companies in over the world.
Contact Us:
If you have any queries regarding this report or if you would like further information, please contact us:
QY Research Inc.
Add: 17890 Castleton Street Suite 369 City of Industry CA 91748 United States
EN: https://www.qyresearch.com
Email: global@qyresearch.com
Tel: 001-626-842-1666(US)
JP: https://www.qyresearch.co.jp