日別アーカイブ: 2026年5月29日

Ticket Resale Platforms Research:approximately US$2.315 billion in 2025

QY Research Inc. (Global Market Report Research Publisher) announces the release of 2025 latest report “Ticket Resale Platform- Global Market Share and Ranking, Overall Sales and Demand Forecast 2026-2032”. Based on current situation and impact historical analysis (2020-2024) and forecast calculations (2026-2032), this report provides a comprehensive analysis of the global Ticket Resale Platform market, including market size, share, demand, industry development status, and forecasts for the next few years.

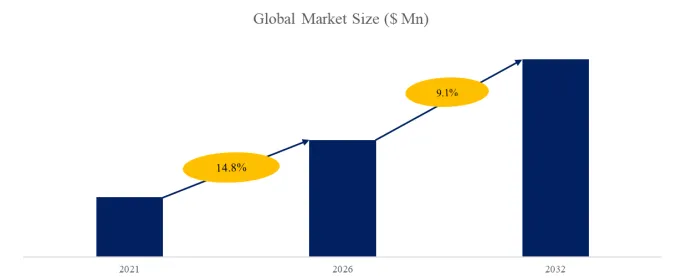
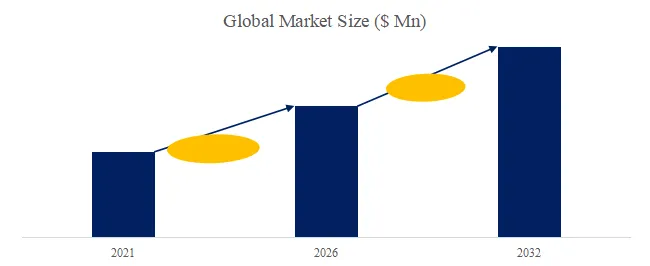
The global market for Ticket Resale Platform was estimated to be worth US$ 2315 million in 2025 and is projected to reach US$ 4098 million, growing at a CAGR of 8.5% from 2026 to 2032.

【Get a free sample PDF of this report (Including Full TOC, List of Tables & Figures, Chart)】
https://www.qyresearch.com/reports/6699577/ticket-resale-platform


Ticket Resale Platform Product Overview

Ticket Resale Platforms are online or offline platforms that provide secondary ticketing services, allowing original ticket purchasers or holders to legally resell purchased tickets to other consumers. These platforms typically offer ticket verification, price formation, transaction security, and ticket delivery services to ensure transaction security and ticket authenticity. Resale platforms support various transaction models, including consumer-to-consumer (C2C), business-to-consumer (B2C), and officially certified resale models, covering sporting events, concerts, theater, festivals, and other large-scale events. Platform features typically include digital ticket transfer, dynamic pricing algorithms, mobile applications, and official barcode verification, capable of meeting the needs of reselling sold-out events, last-minute ticket purchases, and high-value seat upgrades. Resale platforms are an important part of the global ticketing ecosystem, with mature supply systems particularly prevalent in North America and Europe. In 2025, the gross profit margin of Ticket Resale Platforms was approximately 54.43%.

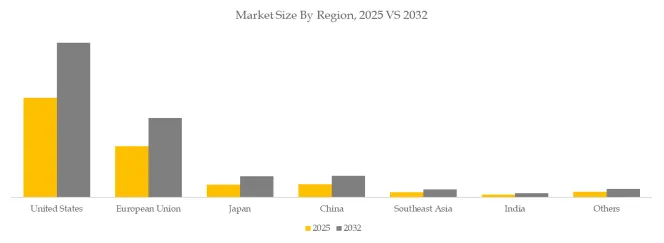
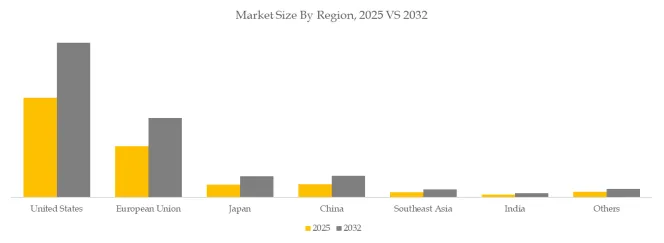
From a supply perspective, the North American market is the most mature region for Ticket Resale Platform, with a high concentration of platforms. Major companies include StubHub (including Viagogo), Ticketmaster Exchange, SeatGeek, and TickPick. The European market is dominated by fan-to-fan platforms such as TicketSwap and Twickets, with numerous but fragmented companies. In Japan and South Korea, the resale market is dominated by officially certified resellers, and independent platforms are relatively few due to real-name registration and anti-scalping policies. In China, the market is still primarily driven by the official resale functions of primary ticketing platforms, with independent secondary ticketing platforms virtually nonexistent. Overall, North America and Europe are the core supply areas, while Japan, South Korea, and China are restricted markets affected by policies and real-name registration.

From a demand structure perspective, Ticket Resale Platform mainly meet the needs of three types of users: first, replenishing tickets for sold-out events; second, last-minute ticket purchases for upcoming performances or events; and third, upgrading to premium seats or VIP areas. Different event types, platforms, and delivery methods significantly impact transaction frequency and price formation mechanisms. Officially certified resale platforms can improve transaction security and ticket credibility, while open C2C platforms emphasize price flexibility and supply diversity.

From an industry trend perspective, technology is driving transparency and compliance in the resale ticket market. Mobile apps, digital wallet transfers, official barcode verification, and dynamic pricing algorithms have become mainstream. In the future, the resale ticket market may see further regional concentration and integration with official platforms, while compliance regulations and fan protection policies will continue to affect price elasticity and platform operating models.


Ticket Resale Platform Market Summary

According to the latest market research report from QYResearch, the global Ticket Resale Platform market size will be approximately US$2.315 billion in 2025.

Figure00001. Global Ticket Resale Platform Market Size (US$ Million), 2021-2032
Ticket Resale Platforms

Above data is based on report from QYResearch: Global Ticket Resale Platform Market Report 2021-2032 (published in 2025). If you need the latest data, plaese contact QYResearch.


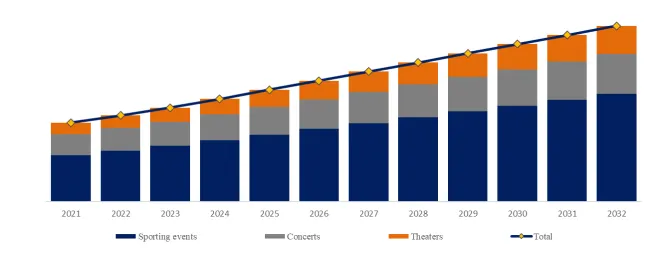
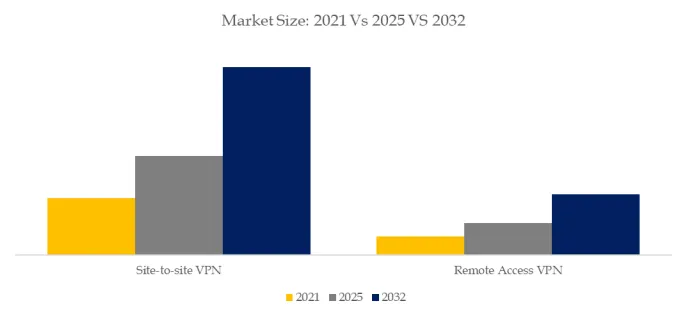
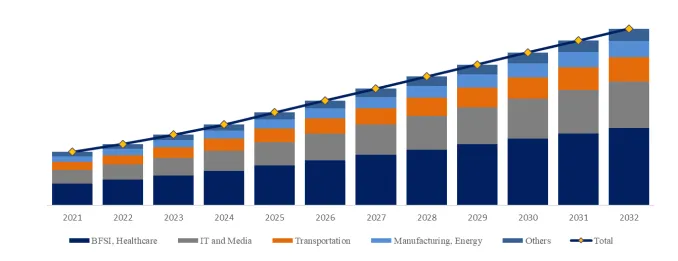
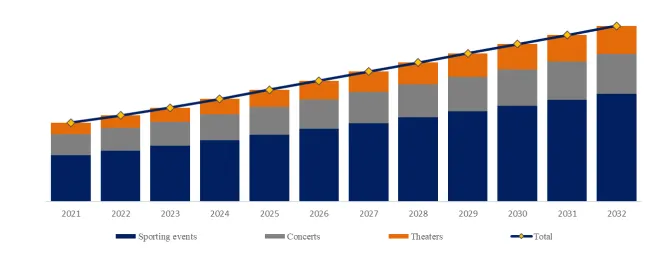
Figure00002. Ticket Resale Platform, Global Market Size, Split by Product Segment
Ticket Resale Platforms

Based on or includes research from QYResearch: Global Ticket Resale Platform Market Report 2021-2032.

In terms of product type, currently Sporting events is the largest segment, hold a share of 59.9%.

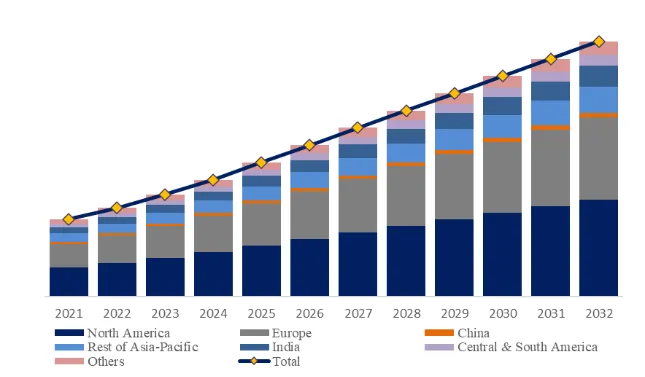
Figure00003. Ticket Resale Platform, Global Market Size, Split by Region
Ticket Resale Platforms

Based on or includes research from QYResearch: Global Ticket Resale Platform Market Report 2021-2032.

The report provides a detailed analysis of the market size, growth potential, and key trends for each segment. Through detailed analysis, industry players can identify profit opportunities, develop strategies for specific customer segments, and allocate resources effectively.

The Ticket Resale Platform market is segmented as below:
By Company
StubHub(Viagogo)
Ticketmaster(Live Nation Entertainment)
Vivid Seats
TicketIQ
RazorGator(TickPick)
SeatGeek
Alliance Tickets
Coast to Coast Tickets
TicketCity
TicketNetwork
AXS Marketplace(AEG)
Gametime
EventTicketCenter
TicketSwap
Twickets
Ticket Camp(Mixi)
Interpark Ticket
Melon Ticket
GoTickets
Ticmint
See Tickets
Seated
Platinumlist
FanFair Alliance
CashorTrade
BookMyShow Resale
Dice
Tixel
MoreTickets
Dahepiao

Segment by Type
Official Resale
Fan-to-Fan Tickets
Brokered Tickets
Other

Segment by Application
Sporting Events
Concerts
Theaters
Others

Each chapter of the report provides detailed information for readers to further understand the Ticket Resale Platform market:

Chapter 1: Introduces the report scope of the Ticket Resale Platform report, global total market size (valve, volume and price). This chapter also provides the market dynamics, latest developments of the market, the driving factors and restrictive factors of the market, the challenges and risks faced by manufacturers in the industry, and the analysis of relevant policies in the industry. (2021-2032)
Chapter 2: Detailed analysis of Ticket Resale Platform manufacturers competitive landscape, price, sales and revenue market share, latest development plan, merger, and acquisition information, etc. (2021-2026)
Chapter 3: Provides the analysis of various Ticket Resale Platform market segments by Type, covering the market size and development potential of each market segment, to help readers find the blue ocean market in different market segments. (2021-2032)
Chapter 4: Provides the analysis of various market segments by Application, covering the market size and development potential of each market segment, to help readers find the blue ocean market in different downstream markets.(2021-2032)
Chapter 5: Sales, revenue of Ticket Resale Platform in regional level. It provides a quantitative analysis of the market size and development potential of each region and introduces the market development, future development prospects, market space, and market size of each country in the world..(2021-2032)
Chapter 6: Sales, revenue of Ticket Resale Platform in country level. It provides sigmate data by Type, and by Application for each country/region.(2021-2032)
Chapter 7: Provides profiles of key players, introducing the basic situation of the main companies in the market in detail, including product sales, revenue, price, gross margin, product introduction, recent development, etc. (2021-2026)
Chapter 8: Analysis of industrial chain, including the upstream and downstream of the industry.
Chapter 9: Conclusion.

Benefits of purchasing QYResearch report:
Competitive Analysis: QYResearch provides in-depth Ticket Resale Platform competitive analysis, including information on key company profiles, new entrants, acquisitions, mergers, large market shear, opportunities, and challenges. These analyses provide clients with a comprehensive understanding of market conditions and competitive dynamics, enabling them to develop effective market strategies and maintain their competitive edge.

Industry Analysis: QYResearch provides Ticket Resale Platform comprehensive industry data and trend analysis, including raw material analysis, market application analysis, product type analysis, market demand analysis, market supply analysis, downstream market analysis, and supply chain analysis.

and trend analysis. These analyses help clients understand the direction of industry development and make informed business decisions.

Market Size: QYResearch provides Ticket Resale Platform market size analysis, including capacity, production, sales, production value, price, cost, and profit analysis. This data helps clients understand market size and development potential, and is an important reference for business development.

Other relevant reports of QYResearch:
Global Ticket Resale Platform Sales Market Report, Competitive Analysis and Regional Opportunities 2026-2032
Global Ticket Resale Platform Market Outlook, In‑Depth Analysis & Forecast to 2032
Global Ticket Resale Platform Market Research Report 2026

About Us:
QYResearch founded in California, USA in 2007, which is a leading global market research and consulting company. Our primary business include market research reports, custom reports, commissioned research, IPO consultancy, business plans, etc. With over 19 years of experience and a dedicated research team, we are well placed to provide useful information and data for your business, and we have established offices in 7 countries (include United States, Germany, Switzerland, Japan, Korea, China and India) and business partners in over 30 countries. We have provided industrial information services to more than 60,000 companies in over the world.

Contact Us:
If you have any queries regarding this report or if you would like further information, please contact us:
QY Research Inc.
Add: 17890 Castleton Street Suite 369 City of Industry CA 91748 United States
EN: https://www.qyresearch.com
Email: global@qyresearch.com
Tel: 001-626-842-1666(US)
JP: https://www.qyresearch.co.jp

カテゴリー: 未分類 | 投稿者huangsisi 12:51 | コメントをどうぞ

Surface Protective Film for Electronics Research:CAGR of 5.5% during the forecast period 2026-2032

QY Research Inc. (Global Market Report Research Publisher) announces the release of 2025 latest report “Surface Protective Film for Electronics- Global Market Share and Ranking, Overall Sales and Demand Forecast 2026-2032”. Based on current situation and impact historical analysis (2020-2024) and forecast calculations (2026-2032), this report provides a comprehensive analysis of the global Surface Protective Film for Electronics market, including market size, share, demand, industry development status, and forecasts for the next few years.

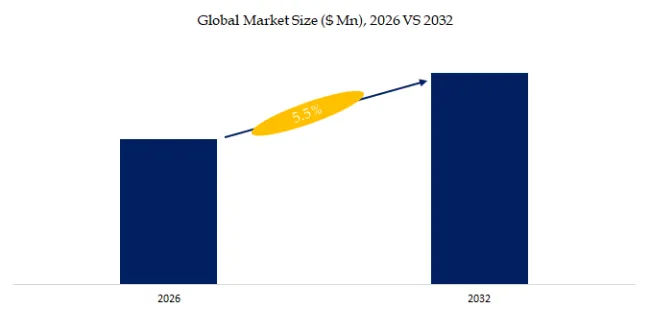
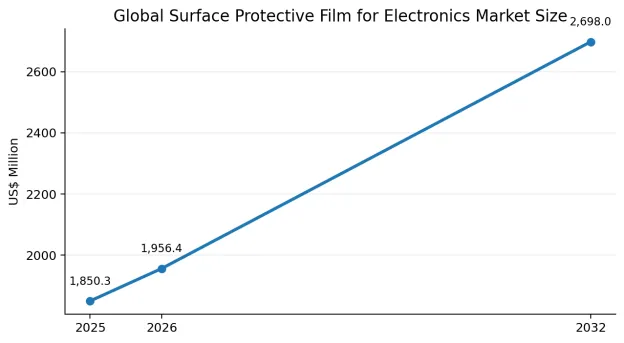
The global market for Surface Protective Film for Electronics was estimated to be worth US$ 1850 million in 2025 and is projected to reach US$ 2698 million, growing at a CAGR of 5.5% from 2026 to 2032.

【Get a free sample PDF of this report (Including Full TOC, List of Tables & Figures, Chart)】
https://www.qyresearch.com/reports/5718836/surface-protective-film-for-electronics


Surface Protective Film for Electronics Market Summary

Surface Protective Film for Electronics refers to functional protective films used on electronic products and components during manufacturing, transportation, assembly and end-use handling. It is typically based on PET, PE, PP or other polymer films with acrylic, silicone or specialty adhesive systems, designed to protect displays, touch panels, housings, optical films, semiconductor parts and precision surfaces from scratches, dust, stains, static electricity and process damage.

The market is steadily expanding as consumer electronics, display panels, smart devices, automotive electronics and semiconductor applications continue to require cleaner processing, higher optical clarity, lower residue and more reliable temporary protection. Product differentiation is increasingly driven by coating uniformity, adhesive stability, antistatic performance, low-residue removal, cleanroom converting and customized die-cutting capability.


2025 Market Size
US$1,850.3 Mn

2026 Market Size
US$1,956.4 Mn
Base year forecast

2032 Market Size
US$2,698.0 Mn
Forecast

2026-2032 CAGR
5.50%
Forecast period


According to the new market research report “Global Surface Protective Film for Electronics Market Report 2026-2032″, published by QYResearch, the global market for Surface Protective Film for Electronics was valued at US$ 1,850.3 million in the year 2025 and is projected to reach a revised size of US$ 2,698.0 million by 2032, growing at a CAGR of 5.5% during the forecast period 2026-2032.

Figure00001. Global Surface Protective Film for Electronics Market Size (US$ Million), 2026 VS 2032

Surface Protective Film for Electronics

Above data is based on report from QYResearch: Global Surface Protective Film for ElectronicsMarket Report 2026-2032(published in 2026). If you need the latest data, plaese contact QYResearch.

Figure00002. Global Surface Protective Film for Electronics Market Size (US$ Million), 2025-2032

Surface Protective Film for Electronics

Above data is based on report from QYResearch: Global Surface Protective Film for ElectronicsMarket Report 2026-2032(published in 2026). If you need the latest data, plaese contact QYResearch.

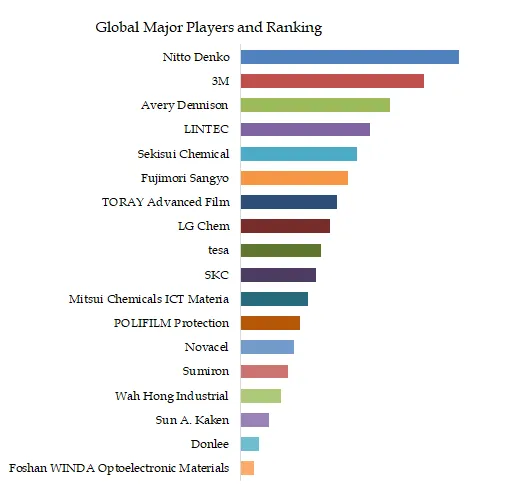
Figure00003. Global Surface Protective Film for Electronics Top 18 Players Ranking and Market Share (Ranking is based on the revenue of 2025, continually updated)

Surface Protective Film for Electronics

Above data is based on report from QYResearch: Global Surface Protective Film for ElectronicsMarket Report 2026-2032 (published in 2026). If you need the latest data, plaese contact QYResearch.

Competition is led by companies with strong capabilities in film substrate processing, adhesive formulation, precision coating, cleanroom converting, optical/electronic material qualification and global customer service. Key participants include 3M, Sumiron, Avery Dennison, Nitto Denko, etc.


Table 1. Surface Protective Film for Electronics Industry Development Trends

Development Trends Description
1 Higher Requirements for Cleanliness and Low Residue Surface protective films for electronics are increasingly required to provide stable adhesion while leaving minimal residue after removal. As electronic components become more delicate, films must reduce contamination, adhesive transfer, static charge, and surface defects during processing, transportation, and assembly.
2 Development Toward Thinner and More Precise Film Structures The market is shifting toward thinner, flatter, and more uniform protective films. Better thickness control, optical clarity, dimensional stability, and surface smoothness are becoming important as the films are used in display panels, touch modules, semiconductor-related components, and precision electronic surfaces.
3 Functional Integration and Material Upgrading Protective films are evolving from simple anti-scratch materials to multifunctional films with anti-static, heat-resistant, UV-resistant, optical-grade, easy-peel, and process-compatible properties. Material systems such as PET, PE, PP, TPU, and specialty adhesive layers are being optimized for different electronic manufacturing environments.

Source: Secondary Sources, Press Releases, Expert Interviews and QYResearch, 2026

Table 2. Surface Protective Film for Electronics Industry Development Opportunities

Development Opportunities Description
1 Continuous Expansion of Electronic Device Manufacturing The growth of smartphones, tablets, laptops, wearable devices, automotive electronics, and smart home products creates stable demand for surface protection during production and logistics. As electronic products use more glass, metal, plastic, and coated surfaces, the need for customized protective films continues to rise.
2 Demand Growth from Advanced Displays and Precision Components OLED, Mini LED, flexible displays, camera modules, sensors, and precision optical components require higher-performance protective films. These applications create opportunities for suppliers that can provide films with better cleanliness, optical performance, adhesion stability, and compatibility with automated manufacturing.
3 Import Substitution and Customized Local Supply Electronics manufacturers increasingly require shorter lead times, localized technical support, and customized film solutions. This creates opportunities for regional suppliers, especially those with coating, adhesive formulation, slitting, and cleanroom production capabilities, to replace imported products in selected mid- to high-end applications.

Source: Secondary Sources, Press Releases, Expert Interviews and QYResearch, 2026

Table 3. Surface Protective Film for Electronics Obstacles/Challenges to Industry Development

Obstacles/Challenges Description
1 High Technical Barriers in Cleanliness and Stability Electronic applications require strict control of particles, gels, bubbles, adhesive residue, electrostatic discharge, and surface defects. Small quality fluctuations may lead to production yield losses for downstream customers, so suppliers must maintain stable cleanroom manufacturing, coating uniformity, and quality inspection capabilities.
2 Intense Price Competition and Cost Pressure Many standard protective film products have relatively mature technology and strong price competition. Raw material price fluctuations, customer cost reduction demands, and competition from regional manufacturers can compress profit margins, especially in general-purpose electronics protection films.
3 Difficulty in Balancing Adhesion, Protection, and Easy Removal Protective films must adhere firmly during processing and transportation but also be removed cleanly without damaging surfaces or leaving marks. Different substrates, surface coatings, temperatures, and process conditions make product design complex, requiring continuous formulation adjustment and application testing.

Source: Secondary Sources, Press Releases, Expert Interviews and QYResearch, 2026


Future development will focus on cleaner coating processes, more stable adhesive systems, higher optical-grade performance, antistatic and multifunctional film structures, and deeper collaboration with display, semiconductor, automotive electronics and smart-device manufacturers. Suppliers with precision coating, formulation, converting and global qualification capabilities are expected to strengthen their market position.

The report provides a detailed analysis of the market size, growth potential, and key trends for each segment. Through detailed analysis, industry players can identify profit opportunities, develop strategies for specific customer segments, and allocate resources effectively.

The Surface Protective Film for Electronics market is segmented as below:
By Company
3M
Sumiron
Avery Dennison
Nitto Denko
Fujimori Sangyo
Sekisui Chemical
Sun A. Kaken
TORAY Advanced Film
Mitsui Chemicals ICT Materia
LINTEC
LG Chem
SKC
tesa
POLIFILM Protection
Novacel
Donlee
Foshan WINDA Optoelectronic Materials
Wah Hong Industrial

Segment by Type
Low Adhesion Type (<50 gf/25mm)
Medium Adhesion Type (50–200 gf/25mm)
High Adhesion Type (200–500 gf/25mm)
Ultra-High Adhesion Type (>500 gf/25mm)

Segment by Application
Display Panels
Touch Panels
Optical Films
Electronic Device Housings
Semiconductor Components
Electronic Assembly and Transportation
Others

Each chapter of the report provides detailed information for readers to further understand the Surface Protective Film for Electronics market:

Chapter 1: Introduces the report scope of the Surface Protective Film for Electronics report, global total market size (valve, volume and price). This chapter also provides the market dynamics, latest developments of the market, the driving factors and restrictive factors of the market, the challenges and risks faced by manufacturers in the industry, and the analysis of relevant policies in the industry. (2021-2032)
Chapter 2: Detailed analysis of Surface Protective Film for Electronics manufacturers competitive landscape, price, sales and revenue market share, latest development plan, merger, and acquisition information, etc. (2021-2026)
Chapter 3: Provides the analysis of various Surface Protective Film for Electronics market segments by Type, covering the market size and development potential of each market segment, to help readers find the blue ocean market in different market segments. (2021-2032)
Chapter 4: Provides the analysis of various market segments by Application, covering the market size and development potential of each market segment, to help readers find the blue ocean market in different downstream markets.(2021-2032)
Chapter 5: Sales, revenue of Surface Protective Film for Electronics in regional level. It provides a quantitative analysis of the market size and development potential of each region and introduces the market development, future development prospects, market space, and market size of each country in the world..(2021-2032)
Chapter 6: Sales, revenue of Surface Protective Film for Electronics in country level. It provides sigmate data by Type, and by Application for each country/region.(2021-2032)
Chapter 7: Provides profiles of key players, introducing the basic situation of the main companies in the market in detail, including product sales, revenue, price, gross margin, product introduction, recent development, etc. (2021-2026)
Chapter 8: Analysis of industrial chain, including the upstream and downstream of the industry.
Chapter 9: Conclusion.

Benefits of purchasing QYResearch report:
Competitive Analysis: QYResearch provides in-depth Surface Protective Film for Electronics competitive analysis, including information on key company profiles, new entrants, acquisitions, mergers, large market shear, opportunities, and challenges. These analyses provide clients with a comprehensive understanding of market conditions and competitive dynamics, enabling them to develop effective market strategies and maintain their competitive edge.

Industry Analysis: QYResearch provides Surface Protective Film for Electronics comprehensive industry data and trend analysis, including raw material analysis, market application analysis, product type analysis, market demand analysis, market supply analysis, downstream market analysis, and supply chain analysis.

and trend analysis. These analyses help clients understand the direction of industry development and make informed business decisions.

Market Size: QYResearch provides Surface Protective Film for Electronics market size analysis, including capacity, production, sales, production value, price, cost, and profit analysis. This data helps clients understand market size and development potential, and is an important reference for business development.

Other relevant reports of QYResearch:
Global Surface Protective Film for Electronics Market Outlook, In‑Depth Analysis & Forecast to 2032
Global Surface Protective Film for Electronics Sales Market Report, Competitive Analysis and Regional Opportunities 2026-2032
Global Surface Protective Film for Electronics Market Research Report 2026

About Us:
QYResearch founded in California, USA in 2007, which is a leading global market research and consulting company. Our primary business include market research reports, custom reports, commissioned research, IPO consultancy, business plans, etc. With over 19 years of experience and a dedicated research team, we are well placed to provide useful information and data for your business, and we have established offices in 7 countries (include United States, Germany, Switzerland, Japan, Korea, China and India) and business partners in over 30 countries. We have provided industrial information services to more than 60,000 companies in over the world.

Contact Us:
If you have any queries regarding this report or if you would like further information, please contact us:
QY Research Inc.
Add: 17890 Castleton Street Suite 369 City of Industry CA 91748 United States
EN: https://www.qyresearch.com
Email: global@qyresearch.com
Tel: 001-626-842-1666(US)
JP: https://www.qyresearch.co.jp
カテゴリー: 未分類 | 投稿者huangsisi 12:50 | コメントをどうぞ

Secondary Tickets Research:approximately US$2.315 billion in 2025

QY Research Inc. (Global Market Report Research Publisher) announces the release of 2025 latest report “Secondary Tickets- Global Market Share and Ranking, Overall Sales and Demand Forecast 2026-2032”. Based on current situation and impact historical analysis (2020-2024) and forecast calculations (2026-2032), this report provides a comprehensive analysis of the global Secondary Tickets market, including market size, share, demand, industry development status, and forecasts for the next few years.

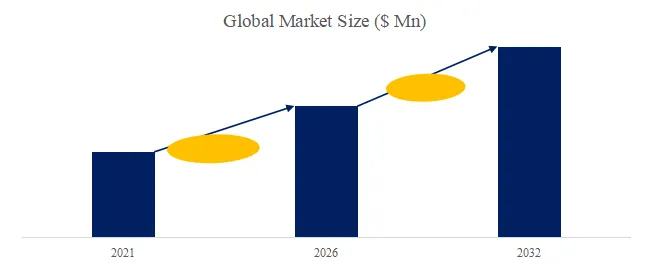
The global market for Secondary Tickets was estimated to be worth US$ 2315 million in 2025 and is projected to reach US$ 4098 million, growing at a CAGR of 8.5% from 2026 to 2032.

【Get a free sample PDF of this report (Including Full TOC, List of Tables & Figures, Chart)】
https://www.qyresearch.com/reports/5502546/secondary-tickets


Secondary Tickets Product Overview

Secondary tickets refer to tickets already held by the original purchaser or holder and resold through channels other than primary ticketing. Unlike primary tickets, secondary tickets are typically resold through professional secondary ticketing platforms, ticket brokers, or individual transactions, involving legitimate price formation, ticket verification, and delivery services. Secondary ticket transactions cover various event types, including sporting events, concerts, theater productions, and large festivals, and can be conducted through consumer-to-consumer (C2C), business-to-consumer (B2C), or officially certified resales. The secondary ticket market emphasizes ticket authenticity, transaction security, and flexible delivery methods, and is an important part of the global ticketing ecosystem. In 2025, the gross profit margin for secondary tickets was approximately 54.43%.

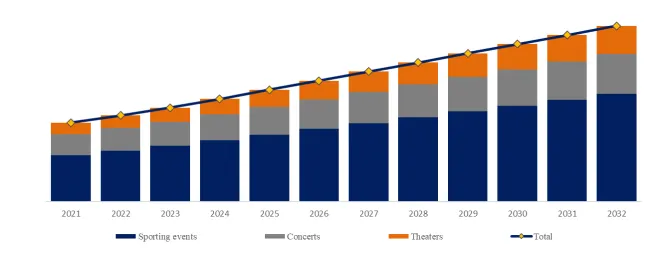
The major players in global Secondary Tickets market include StubHub, Ticketmaster, TicketNetwork, etc. The top 3 players occupy about 45% shares of the global market. North America and Europe are main markets, they occupy about 80% of the global market. Offline Platform and Online Platform are two types. Sporting events is the main application, which holds a share about 60%.

From a global supply perspective, the North American market is the most mature region for secondary tickets, with a high concentration of platforms. Major companies include StubHub (including Viagogo), Ticketmaster Exchange, SeatGeek, and TickPick. The European market is dominated by fan-to-fan platforms such as TicketSwap and Twickets, with numerous but fragmented companies. In Japan and South Korea, the market is dominated by officially certified resellers. Due to real-name registration and anti-scalping policies, independent secondary ticketing platforms are relatively few. In China, the market is still primarily driven by the official secondary resale functions of primary ticketing platforms, with independent secondary ticketing platforms virtually nonexistent. Overall, North America and Europe are the core secondary ticket supply areas, while Japan, South Korea, and China are restricted markets affected by policies and real-name registration.

From a demand perspective, secondary tickets mainly meet the needs of three types of users: first, replenishing tickets for sold-out events; second, last-minute ticket purchases for upcoming performances or events; and third, upgrading to premium seats or VIP areas. Different event types, ticketing platforms, and delivery methods significantly impact transaction frequency and price formation mechanisms. Officially certified resale platforms can improve transaction security and ticket credibility, while open C2C platforms emphasize price flexibility and supply diversity.

From an industry trend perspective, technology is driving transparency and compliance in the secondary ticketing market. Mobile apps, digital wallet transfers, official barcode verification, and dynamic pricing algorithms are becoming mainstream. In the future, the secondary ticket market may see further regional concentration and integration with official platforms. Meanwhile, compliance regulations and fan protection policies will continue to influence price elasticity and platform operation models.


Secondary Tickets Market Summary

According to the latest market research report from QYResearch, the global secondary ticket market size will be approximately US$2.315 billion in 2025.

Figure00001. Global Secondary Tickets Market Size (US$ Million), 2021-2032

Secondary Tickets

Above data is based on report from QYResearch: Global Secondary Tickets Market Report 2021-2032 (published in 2025). If you need the latest data, plaese contact QYResearch.


Figure00002. Secondary Tickets, Global Market Size, Split by Product Segment

Secondary Tickets

Based on or includes research from QYResearch: Global Secondary Tickets Market Report 2021-2032.

In terms of product type, currently Sporting events is the largest segment, hold a share of 59.9%.

Figure00003. Secondary Tickets, Global Market Size, Split by Region

Secondary Tickets

Based on or includes research from QYResearch: Global Secondary Tickets Market Report 2021-2032.

The report provides a detailed analysis of the market size, growth potential, and key trends for each segment. Through detailed analysis, industry players can identify profit opportunities, develop strategies for specific customer segments, and allocate resources effectively.

The Secondary Tickets market is segmented as below:
By Company
StubHub(Viagogo)
Ticketmaster(Live Nation Entertainment)
Vivid Seats
TicketIQ
RazorGator(TickPick)
SeatGeek
Alliance Tickets
Coast to Coast Tickets
TicketCity
TicketNetwork
AXS Marketplace(AEG)
Gametime
EventTicketCenter
TicketSwap
Twickets
Ticket Camp(Mixi)
Interpark Ticket
Melon Ticket
GoTickets
Ticmint
See Tickets
Seated
Platinumlist
FanFair Alliance
CashorTrade
BookMyShow Resale
Dice
Tixel
MoreTickets
Dahepiao

Segment by Type
Official Resale
Fan-to-Fan Tickets
Brokered Tickets

Segment by Application
Sporting Events
Concerts
Theaters
Others

Each chapter of the report provides detailed information for readers to further understand the Secondary Tickets market:

Chapter 1: Introduces the report scope of the Secondary Tickets report, global total market size (valve, volume and price). This chapter also provides the market dynamics, latest developments of the market, the driving factors and restrictive factors of the market, the challenges and risks faced by manufacturers in the industry, and the analysis of relevant policies in the industry. (2021-2032)
Chapter 2: Detailed analysis of Secondary Tickets manufacturers competitive landscape, price, sales and revenue market share, latest development plan, merger, and acquisition information, etc. (2021-2026)
Chapter 3: Provides the analysis of various Secondary Tickets market segments by Type, covering the market size and development potential of each market segment, to help readers find the blue ocean market in different market segments. (2021-2032)
Chapter 4: Provides the analysis of various market segments by Application, covering the market size and development potential of each market segment, to help readers find the blue ocean market in different downstream markets.(2021-2032)
Chapter 5: Sales, revenue of Secondary Tickets in regional level. It provides a quantitative analysis of the market size and development potential of each region and introduces the market development, future development prospects, market space, and market size of each country in the world..(2021-2032)
Chapter 6: Sales, revenue of Secondary Tickets in country level. It provides sigmate data by Type, and by Application for each country/region.(2021-2032)
Chapter 7: Provides profiles of key players, introducing the basic situation of the main companies in the market in detail, including product sales, revenue, price, gross margin, product introduction, recent development, etc. (2021-2026)
Chapter 8: Analysis of industrial chain, including the upstream and downstream of the industry.
Chapter 9: Conclusion.

Benefits of purchasing QYResearch report:
Competitive Analysis: QYResearch provides in-depth Secondary Tickets competitive analysis, including information on key company profiles, new entrants, acquisitions, mergers, large market shear, opportunities, and challenges. These analyses provide clients with a comprehensive understanding of market conditions and competitive dynamics, enabling them to develop effective market strategies and maintain their competitive edge.

Industry Analysis: QYResearch provides Secondary Tickets comprehensive industry data and trend analysis, including raw material analysis, market application analysis, product type analysis, market demand analysis, market supply analysis, downstream market analysis, and supply chain analysis.

and trend analysis. These analyses help clients understand the direction of industry development and make informed business decisions.

Market Size: QYResearch provides Secondary Tickets market size analysis, including capacity, production, sales, production value, price, cost, and profit analysis. This data helps clients understand market size and development potential, and is an important reference for business development.

Other relevant reports of QYResearch:
Global Secondary Tickets Market Outlook, In‑Depth Analysis & Forecast to 2032
Global Secondary Tickets Sales Market Report, Competitive Analysis and Regional Opportunities 2026-2032
Global Secondary Tickets Market Research Report 2026

About Us:
QYResearch founded in California, USA in 2007, which is a leading global market research and consulting company. Our primary business include market research reports, custom reports, commissioned research, IPO consultancy, business plans, etc. With over 19 years of experience and a dedicated research team, we are well placed to provide useful information and data for your business, and we have established offices in 7 countries (include United States, Germany, Switzerland, Japan, Korea, China and India) and business partners in over 30 countries. We have provided industrial information services to more than 60,000 companies in over the world.

Contact Us:
If you have any queries regarding this report or if you would like further information, please contact us:
QY Research Inc.
Add: 17890 Castleton Street Suite 369 City of Industry CA 91748 United States
EN: https://www.qyresearch.com
Email: global@qyresearch.com
Tel: 001-626-842-1666(US)
JP: https://www.qyresearch.co.jp
カテゴリー: 未分類 | 投稿者huangsisi 12:49 | コメントをどうぞ

Robotic Camera Systems for Broadcast & Virtual Production Research:CAGR of 8.6% during the forecast period 2026-2032

QY Research Inc. (Global Market Report Research Publisher) announces the release of 2025 latest report “Robotic Camera Systems for Broadcast & Virtual Production- Global Market Share and Ranking, Overall Sales and Demand Forecast 2026-2032”. Based on current situation and impact historical analysis (2020-2024) and forecast calculations (2026-2032), this report provides a comprehensive analysis of the global Robotic Camera Systems for Broadcast & Virtual Production market, including market size, share, demand, industry development status, and forecasts for the next few years.

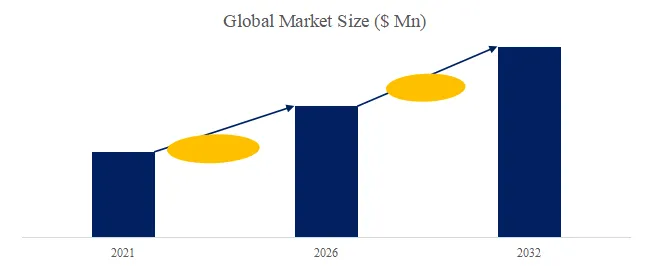
The global market for Robotic Camera Systems for Broadcast & Virtual Production was estimated to be worth US$ 632 million in 2025 and is projected to reach US$ 1129 million, growing at a CAGR of 8.6% from 2026 to 2032.

【Get a free sample PDF of this report (Including Full TOC, List of Tables & Figures, Chart)】
https://www.qyresearch.com/reports/6707924/robotic-camera-systems-for-broadcast—virtual-production


Robotic Camera Systems for Broadcast & Virtual Production Market Summary

Robotic camera systems for broadcast and virtual production are intelligent production systems that combine high-definition imaging, precision motion control, AI-assisted tracking, real-time signal transmission, and professional production software. They typically include robotic camera heads, rails or pedestals, control panels, tracking modules, and workflow software, enabling smooth pan, tilt, push, pull, lift, and repeatable programmed camera movements in studios, live events, virtual studios, LED volumes, and hybrid production environments.

The market is moving from equipment automation toward workflow automation. As broadcasters, studios, venues, enterprises, and streaming producers look for leaner teams, remote operation, and consistent high-quality output, robotic camera systems are becoming an essential bridge between physical camera movement and digital virtual-production pipelines.


2025 Market Size
US$632.0 Mn
Global market value

2032 Forecast
US$1,129.1 Mn
Projected market size

CAGR
8.6%
2026-2032 forecast period


According to the new market research report “Global Robotic Camera Systems for Broadcast & Virtual Production Market Report 2026-2032″, published by QYResearch, the global market for Robotic Camera Systems for Broadcast & Virtual Production was valued at US$ 632.0 million in the year 2025 and is projected to reach a revised size of US$ 1,129.1 million by 2032, growing at a CAGR of 8.6% during the forecast period 2026-2032.

Figure00001. Global Robotic Camera Systems for Broadcast & Virtual Production Market Size (US$ Million), 2026 VS 2032

Robotic Camera Systems for Broadcast & Virtual Production

Above data is based on report from QYResearch: Global Robotic Camera Systems for Broadcast & Virtual Production Market Report 2026-2032(published in 2026). If you need the latest data, plaese contact QYResearch.


Figure00002. Market Size and Growth Outlook

Robotic Camera Systems for Broadcast & Virtual Production

Global market size outlook, 2025 and 2032

Above data is based on report from QYResearch: Global Robotic Camera Systems for Broadcast & Virtual Production Market Report 2026-2032(published in 2026). If you need the latest data, plaese contact QYResearch

Figure00003. Global Robotic Camera Systems for Broadcast & Virtual Production Top 18 Players Ranking and Market Share (Ranking is based on the revenue of 2025, continually updated)

Robotic Camera Systems for Broadcast & Virtual Production

Above data is based on report from QYResearch: Global Robotic Camera Systems for Broadcast & Virtual Production Market Report 2026-2032 (published in 2026). If you need the latest data, plaese contact QYResearch.


The competitive landscape includes broadcast-automation specialists, professional camera manufacturers, virtual-production motion-control companies, PTZ camera suppliers, and system solution providers. Leading vendors differentiate through motion precision, control software, broadcast compatibility, tracking metadata, product reliability, and integration capability with virtual studio systems.

Figure00004. Robotic Camera Systems for Broadcast & Virtual Production Industry Chain Analysis

Robotic Camera Systems for Broadcast & Virtual Production

Source: Secondary Sources, Press Releases, Expert Interviews and QYResearch, 2026

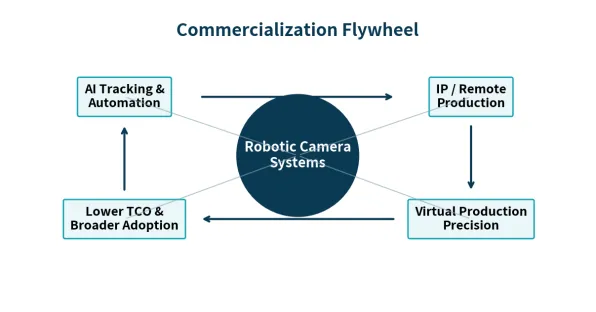
The industry chain is formed by upstream components such as image sensors, lenses, motors, encoders, servo drives, controllers, rails, mechanical structures, AI algorithms, and communication modules; midstream robotic camera system manufacturers and integrators; and downstream users including broadcasters, virtual studios, live-event producers, sports venues, education, corporate media, houses of worship, and streaming platforms.


Table 1. Robotic Camera Systems for Broadcast & Virtual Production Industry Development Trends

Development Trends Description
1 AI-Driven Camera Automation Robotic camera systems are increasingly integrating auto-tracking, intelligent framing, preset recall, and assisted camera movement. This reduces dependence on large camera crews and improves consistency in live broadcast, studio, and virtual production workflows. AI-based tracking and automation are becoming especially important as broadcasters seek leaner and more repeatable operations.
2 IP-Based and Remote Production Integration The shift from hardware-centric control rooms to IP, cloud, and remote production environments is accelerating. Robotic camera systems are being designed for browser-based control, multi-location operation, and integration with distributed production workflows, enabling broadcasters to manage more cameras with fewer on-site operators.
3 Higher Precision for Virtual Production Virtual production requires accurate, repeatable, and synchronized camera motion. As LED volume studios, mixed reality sets, and real-time rendering workflows expand, robotic camera systems are evolving toward smoother motion control, better positional accuracy, and tighter integration with tracking, lighting, and graphics systems.

Source: Secondary Sources, Press Releases, Expert Interviews and QYResearch, 2026

Table 2. Robotic Camera Systems for Broadcast & Virtual Production Industry Development Opportunities

Development Opportunities Description
1 Demand for Leaner Production Teams Broadcasters, studios, and live-event producers are under pressure to control labor and operating costs. Robotic systems allow one operator to control multiple cameras, support unattended camera positions, and reduce the need for large crews, creating strong demand in studios, newsrooms, sports venues, education, and corporate production.
2 Expansion of Virtual Production and Hybrid Studios The rise of virtual sets, real-time graphics, immersive broadcasts, and hybrid physical-digital studios creates new demand for robotic camera systems with accurate movement, repeatable paths, and metadata output. These systems can become a key bridge between physical camera operation and digital scene rendering.
3 Growth of Live Streaming and Multi-Platform Content More organizations are producing professional live video for OTT platforms, social media, enterprise communication, worship, education, and events. This broadens the customer base beyond traditional TV broadcasters and creates opportunities for compact, easy-to-operate, and software-driven robotic camera solutions.

Source: Secondary Sources, Press Releases, Expert Interviews and QYResearch, 2026

Table 3. Robotic Camera Systems for Broadcast & Virtual Production Obstacles/Challenges to Industry Development

Obstacles/Challenges Description
1 High System Integration Complexity Robotic camera systems often need to work with broadcast cameras, lenses, switchers, tracking systems, lighting, graphics engines, and production-control software. Compatibility, calibration, latency, and synchronization issues can make deployment complex, especially in virtual production environments.
2 Cost and Skill Barriers Professional robotic camera systems require investment in hardware, control software, installation, maintenance, and operator training. For smaller studios and emerging content producers, the upfront cost and technical learning curve may slow adoption, even when long-term efficiency benefits are clear.
3 Creative and Operational Limitations Automation improves repeatability, but some productions still require human camera intuition, spontaneous framing, and flexible movement. In live environments, safety, collision avoidance, motion smoothness, and real-time responsiveness remain critical challenges for wider acceptance.

Source: Secondary Sources, Press Releases, Expert Interviews and QYResearch, 2026


Figure00005. Commercialization Flywheel

Robotic Camera Systems for Broadcast & Virtual Production

source: Secondary Sources, Press Releases, Expert Interviews and QYResearch, 2026


Going forward, the field will advance toward greater AI‑enabled autonomy for tracking and intelligent framing, more compact and versatile multi‑axis robots, seamless cloud‑based operation and collaboration, deeper synchronization with virtual sets and LED stages, and broader accessibility through simplified workflows and lower total cost of ownership.

The report provides a detailed analysis of the market size, growth potential, and key trends for each segment. Through detailed analysis, industry players can identify profit opportunities, develop strategies for specific customer segments, and allocate resources effectively.

The Robotic Camera Systems for Broadcast & Virtual Production market is segmented as below:
By Company
Ross Video
Shotoku Broadcast Systems
Videndum
EVS
Panasonic Connect
Sony
Canon
MRMC (Mark Roberts Motion Control)
Mo-Sys Engineering
Electric Friends
Movicom
Datavideo
AVer Information
BirdDog
Marshall Electronics
Telycam
Minrray
MJ Robot Tracking System

Segment by Type
Fixed Robotic Camera System
Rail-Mounted Robotic Camera System
Robotic Pedestal Camera System
Robotic Arm Camera System
Others

Segment by Application
Broadcast Studios
Sports and Live Event Production
Virtual Production and XR Studios
Film and Television Production
Education and Training
Others

Each chapter of the report provides detailed information for readers to further understand the Robotic Camera Systems for Broadcast & Virtual Production market:

Chapter 1: Introduces the report scope of the Robotic Camera Systems for Broadcast & Virtual Production report, global total market size (valve, volume and price). This chapter also provides the market dynamics, latest developments of the market, the driving factors and restrictive factors of the market, the challenges and risks faced by manufacturers in the industry, and the analysis of relevant policies in the industry. (2021-2032)
Chapter 2: Detailed analysis of Robotic Camera Systems for Broadcast & Virtual Production manufacturers competitive landscape, price, sales and revenue market share, latest development plan, merger, and acquisition information, etc. (2021-2026)
Chapter 3: Provides the analysis of various Robotic Camera Systems for Broadcast & Virtual Production market segments by Type, covering the market size and development potential of each market segment, to help readers find the blue ocean market in different market segments. (2021-2032)
Chapter 4: Provides the analysis of various market segments by Application, covering the market size and development potential of each market segment, to help readers find the blue ocean market in different downstream markets.(2021-2032)
Chapter 5: Sales, revenue of Robotic Camera Systems for Broadcast & Virtual Production in regional level. It provides a quantitative analysis of the market size and development potential of each region and introduces the market development, future development prospects, market space, and market size of each country in the world..(2021-2032)
Chapter 6: Sales, revenue of Robotic Camera Systems for Broadcast & Virtual Production in country level. It provides sigmate data by Type, and by Application for each country/region.(2021-2032)
Chapter 7: Provides profiles of key players, introducing the basic situation of the main companies in the market in detail, including product sales, revenue, price, gross margin, product introduction, recent development, etc. (2021-2026)
Chapter 8: Analysis of industrial chain, including the upstream and downstream of the industry.
Chapter 9: Conclusion.

Benefits of purchasing QYResearch report:
Competitive Analysis: QYResearch provides in-depth Robotic Camera Systems for Broadcast & Virtual Production competitive analysis, including information on key company profiles, new entrants, acquisitions, mergers, large market shear, opportunities, and challenges. These analyses provide clients with a comprehensive understanding of market conditions and competitive dynamics, enabling them to develop effective market strategies and maintain their competitive edge.

Industry Analysis: QYResearch provides Robotic Camera Systems for Broadcast & Virtual Production comprehensive industry data and trend analysis, including raw material analysis, market application analysis, product type analysis, market demand analysis, market supply analysis, downstream market analysis, and supply chain analysis.

and trend analysis. These analyses help clients understand the direction of industry development and make informed business decisions.

Market Size: QYResearch provides Robotic Camera Systems for Broadcast & Virtual Production market size analysis, including capacity, production, sales, production value, price, cost, and profit analysis. This data helps clients understand market size and development potential, and is an important reference for business development.

Other relevant reports of QYResearch:
Global Robotic Camera Systems for Broadcast & Virtual Production Market Outlook, In‑Depth Analysis & Forecast to 2032
Global Robotic Camera Systems for Broadcast & Virtual Production Sales Market Report, Competitive Analysis and Regional Opportunities 2026-2032
Global Robotic Camera Systems for Broadcast & Virtual Production Market Research Report 2026

About Us:
QYResearch founded in California, USA in 2007, which is a leading global market research and consulting company. Our primary business include market research reports, custom reports, commissioned research, IPO consultancy, business plans, etc. With over 19 years of experience and a dedicated research team, we are well placed to provide useful information and data for your business, and we have established offices in 7 countries (include United States, Germany, Switzerland, Japan, Korea, China and India) and business partners in over 30 countries. We have provided industrial information services to more than 60,000 companies in over the world.

Contact Us:
If you have any queries regarding this report or if you would like further information, please contact us:
QY Research Inc.
Add: 17890 Castleton Street Suite 369 City of Industry CA 91748 United States
EN: https://www.qyresearch.com
Email: global@qyresearch.com
Tel: 001-626-842-1666(US)
JP: https://www.qyresearch.co.jp
カテゴリー: 未分類 | 投稿者huangsisi 12:47 | コメントをどうぞ

Resale Tickets Research:approximately US$2.315 billion in 2025

QY Research Inc. (Global Market Report Research Publisher) announces the release of 2025 latest report “Ticket Resale Platform- Global Market Share and Ranking, Overall Sales and Demand Forecast 2026-2032”. Based on current situation and impact historical analysis (2020-2024) and forecast calculations (2026-2032), this report provides a comprehensive analysis of the global Ticket Resale Platform market, including market size, share, demand, industry development status, and forecasts for the next few years.

The global market for Ticket Resale Platform was estimated to be worth US$ 2315 million in 2025 and is projected to reach US$ 4098 million, growing at a CAGR of 8.5% from 2026 to 2032.

【Get a free sample PDF of this report (Including Full TOC, List of Tables & Figures, Chart)】
https://www.qyresearch.com/reports/6699577/ticket-resale-platform


Resale Tickets Product Overview

Resale tickets refer to tickets already held by the original purchaser or holder and resold through non-primary ticketing channels. Unlike primary ticketing, resale tickets are typically sold through professional secondary ticketing platforms, ticket brokers, or individual transactions, involving legitimate price formation, ticket verification, and delivery services. Resale tickets cover various event types, including sporting events, concerts, theater productions, and large festivals, and transactions can be C2C, B2C, or officially certified. The market emphasizes ticket authenticity, transaction security, and flexible delivery, and is an important part of the global ticketing ecosystem. In 2025, the gross profit margin of resale tickets was approximately 54.43%.

From a supply perspective, the North American market is the most mature region for resale tickets, with a high concentration of platforms. Major companies include StubHub (including Viagogo), Ticketmaster Exchange, SeatGeek, and TickPick. The European market is dominated by fan-to-fan platforms such as TicketSwap and Twickets, with numerous but fragmented companies. In Japan and South Korea, the resale market is dominated by officially certified resellers, and independent platforms are relatively few due to real-name registration and anti-scalping policies. In China, the market is still primarily driven by the official resale functions of primary ticketing platforms, with independent secondary ticketing platforms virtually nonexistent. Overall, North America and Europe are the core supply areas, while Japan, South Korea, and China are restricted markets affected by policies and real-name registration.

From a demand structure perspective, resale tickets mainly meet the needs of three types of users: first, replenishing tickets for sold-out events; second, last-minute ticket purchases for upcoming performances or events; and third, upgrading to premium seats or VIP areas. Different event types, platforms, and delivery methods significantly impact transaction frequency and price formation mechanisms. Officially certified resale platforms can improve transaction security and ticket credibility, while open C2C platforms emphasize price flexibility and supply diversity.

From an industry trend perspective, technology is driving transparency and compliance in the resale ticket market. Mobile apps, digital wallet transfers, official barcode verification, and dynamic pricing algorithms have become mainstream. In the future, the resale ticket market may see further regional concentration and integration with official platforms, while compliance regulations and fan protection policies will continue to affect price elasticity and platform operating models.


Resale Tickets Market Summary

According to the latest market research report from QYResearch, the global Resale Tickets market size will be approximately US$2.315 billion in 2025.

Figure00001. Global Resale Tickets Market Size (US$ Million), 2021-2032

Resale Tickets

Above data is based on report from QYResearch: Global Resale Tickets Market Report 2021-2032 (published in 2025). If you need the latest data, plaese contact QYResearch.


Figure00002. Resale Tickets, Global Market Size, Split by Product Segment

Resale Tickets

Based on or includes research from QYResearch: Global Resale Tickets Market Report 2021-2032.

In terms of product type, currently Sporting events is the largest segment, hold a share of 59.9%.

Figure00003. Resale Tickets, Global Market Size, Split by Region

Resale Tickets

Based on or includes research from QYResearch: Global Resale Tickets Market Report 2021-2032.

The report provides a detailed analysis of the market size, growth potential, and key trends for each segment. Through detailed analysis, industry players can identify profit opportunities, develop strategies for specific customer segments, and allocate resources effectively.

The Ticket Resale Platform market is segmented as below:
By Company
StubHub(Viagogo)
Ticketmaster(Live Nation Entertainment)
Vivid Seats
TicketIQ
RazorGator(TickPick)
SeatGeek
Alliance Tickets
Coast to Coast Tickets
TicketCity
TicketNetwork
AXS Marketplace(AEG)
Gametime
EventTicketCenter
TicketSwap
Twickets
Ticket Camp(Mixi)
Interpark Ticket
Melon Ticket
GoTickets
Ticmint
See Tickets
Seated
Platinumlist
FanFair Alliance
CashorTrade
BookMyShow Resale
Dice
Tixel
MoreTickets
Dahepiao

Segment by Type
Official Resale
Fan-to-Fan Tickets
Brokered Tickets
Other

Segment by Application
Sporting Events
Concerts
Theaters
Others

Each chapter of the report provides detailed information for readers to further understand the Ticket Resale Platform market:

Chapter 1: Introduces the report scope of the Ticket Resale Platform report, global total market size (valve, volume and price). This chapter also provides the market dynamics, latest developments of the market, the driving factors and restrictive factors of the market, the challenges and risks faced by manufacturers in the industry, and the analysis of relevant policies in the industry. (2021-2032)
Chapter 2: Detailed analysis of Ticket Resale Platform manufacturers competitive landscape, price, sales and revenue market share, latest development plan, merger, and acquisition information, etc. (2021-2026)
Chapter 3: Provides the analysis of various Ticket Resale Platform market segments by Type, covering the market size and development potential of each market segment, to help readers find the blue ocean market in different market segments. (2021-2032)
Chapter 4: Provides the analysis of various market segments by Application, covering the market size and development potential of each market segment, to help readers find the blue ocean market in different downstream markets.(2021-2032)
Chapter 5: Sales, revenue of Ticket Resale Platform in regional level. It provides a quantitative analysis of the market size and development potential of each region and introduces the market development, future development prospects, market space, and market size of each country in the world..(2021-2032)
Chapter 6: Sales, revenue of Ticket Resale Platform in country level. It provides sigmate data by Type, and by Application for each country/region.(2021-2032)
Chapter 7: Provides profiles of key players, introducing the basic situation of the main companies in the market in detail, including product sales, revenue, price, gross margin, product introduction, recent development, etc. (2021-2026)
Chapter 8: Analysis of industrial chain, including the upstream and downstream of the industry.
Chapter 9: Conclusion.

Benefits of purchasing QYResearch report:
Competitive Analysis: QYResearch provides in-depth Ticket Resale Platform competitive analysis, including information on key company profiles, new entrants, acquisitions, mergers, large market shear, opportunities, and challenges. These analyses provide clients with a comprehensive understanding of market conditions and competitive dynamics, enabling them to develop effective market strategies and maintain their competitive edge.

Industry Analysis: QYResearch provides Ticket Resale Platform comprehensive industry data and trend analysis, including raw material analysis, market application analysis, product type analysis, market demand analysis, market supply analysis, downstream market analysis, and supply chain analysis.

and trend analysis. These analyses help clients understand the direction of industry development and make informed business decisions.

Market Size: QYResearch provides Ticket Resale Platform market size analysis, including capacity, production, sales, production value, price, cost, and profit analysis. This data helps clients understand market size and development potential, and is an important reference for business development.

Other relevant reports of QYResearch:
Global Ticket Resale Platform Sales Market Report, Competitive Analysis and Regional Opportunities 2026-2032
Global Ticket Resale Platform Market Outlook, In‑Depth Analysis & Forecast to 2032
Global Ticket Resale Platform Market Research Report 2026

About Us:
QYResearch founded in California, USA in 2007, which is a leading global market research and consulting company. Our primary business include market research reports, custom reports, commissioned research, IPO consultancy, business plans, etc. With over 19 years of experience and a dedicated research team, we are well placed to provide useful information and data for your business, and we have established offices in 7 countries (include United States, Germany, Switzerland, Japan, Korea, China and India) and business partners in over 30 countries. We have provided industrial information services to more than 60,000 companies in over the world.

Contact Us:
If you have any queries regarding this report or if you would like further information, please contact us:
QY Research Inc.
Add: 17890 Castleton Street Suite 369 City of Industry CA 91748 United States
EN: https://www.qyresearch.com
Email: global@qyresearch.com
Tel: 001-626-842-1666(US)
JP: https://www.qyresearch.co.jp
カテゴリー: 未分類 | 投稿者huangsisi 12:32 | コメントをどうぞ

Porous Carbon for CVD Silicon-carbon Anodes Research:gross margin of approximately 24.57%

QY Research Inc. (Global Market Report Research Publisher) announces the release of 2025 latest report “Porous Carbon for CVD Silicon-carbon Anodes- Global Market Share and Ranking, Overall Sales and Demand Forecast 2026-2032”. Based on current situation and impact historical analysis (2020-2024) and forecast calculations (2026-2032), this report provides a comprehensive analysis of the global Porous Carbon for CVD Silicon-carbon Anodes market, including market size, share, demand, industry development status, and forecasts for the next few years.

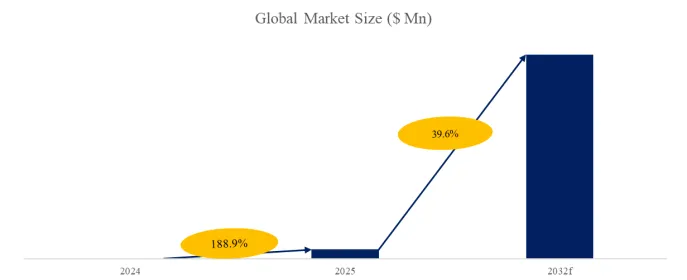
The global market for Porous Carbon for CVD Silicon-carbon Anodes was estimated to be worth US$ 52.83 million in 2025 and is projected to reach US$ 1188 million, growing at a CAGR of 39.6% from 2026 to 2032.

【Get a free sample PDF of this report (Including Full TOC, List of Tables & Figures, Chart)】
https://www.qyresearch.com/reports/6710359/porous-carbon-for-cvd-silicon-carbon-anodes


Porous Carbon for CVD Silicon-carbon Anodes Product Overview

Silicon-carbon anodes offer advantages such as high initial efficiency and low cost; however, their significant expansion force has historically impacted cycle life. Improvements have primarily focused on reducing silicon size to the nanometer scale to minimize the effects of material expansion. Currently, silicon-carbon anode synthesis mainly follows three routes: mechanical ball milling, high-temperature pyrolysis, and chemical vapor deposition (CVD).

Mechanical ball milling involves grinding a suitable silicon and carbon source mixture using a ball mill, followed by sintering. This method grinds silicon to the nanometer scale, achieving a uniform silicon-carbon mixture and mitigating cycle life issues to some extent. Mechanical ball milling significantly improves the electrochemical performance of the material, is simple, and allows for large-scale production. However, the agglomeration of silicon particles during grinding leads to poor cycle performance. Silicon-carbon anodes produced by mechanical ball milling are also called silicon-oxygen anodes, and are not considered downstream applications of porous carbon in this report.

CVD (Chemical Vapor Deposition) utilizes a porous carbon framework to store silicon, and the internal pores of the porous carbon buffer the volume expansion during silicon-lithium intercalation, resulting in low expansion rate, excellent cycle life, and high energy density due to the low density and light weight of the carbon framework itself. CVD silicon-carbon anodes paired with porous carbon substrates effectively improve expansion rate and cycle life issues, exhibiting leading performance and significant development potential, and are poised to become the mainstream next-generation silicon-carbon process.

Definition of Porous Carbon for CVD Silicon-carbon Anodes:

Porous Carbon for CVD Silicon-carbon Anodes serves as the carbon scaffold for silicon-carbon (Si-C) anodes, featuring high specific surface area, controllable microstructure, abundant pore structure, good electrical conductivity, and high stability. Its high specific surface area allows Porous Carbon for CVD Silicon-carbon Anodes to accommodate more lithium ions, providing high capacity for lithium-ion batteries. The multidimensional and complex pore network offers efficient diffusion pathways for lithium ions, resulting in excellent electrochemical performance.

The main raw materials for Porous Carbon for CVD Silicon-carbon Anodes include biomass, resin-based, and coke-based (petroleum coke) materials. Among these three routes:

Biomass-based raw materials include coconut shells, bamboo, rice husks, wood chips, starch, etc., which are renewable and low-cost.

Resin-based raw materials are primarily phenolic resins; their production process is mature, and the chemical structure is controllable, yielding more uniform pores and better batch-to-batch consistency. However, resin-based Porous Carbon for CVD Silicon-carbon Anodes has a significantly higher per-ton cost compared to biomass-based.

Coke-based (petroleum coke) materials fall in between, offering a balance of cost and structural strength.

The core production process for Porous Carbon for CVD Silicon-carbon Anodes is pore-forming activation, primarily through steam or alkali activation. Under high-temperature inert gas protection, the activator is mixed with the carbon precursor to trigger the pore-forming reaction. Typically, the carbon precursor is first carbonized at high temperature (usually above 800 °C), followed by reaction with steam or alkali to generate the porous structure.

In 2025, the global production of Porous Carbon for CVD Silicon-carbon Anodes was approximately 1,637 tons, with an average price of $32,270 per ton and a gross margin of approximately 24.57%.

The major global producers of silicon-carbon porous carbon include Kuraray, Shengquan Group, Fujian Yuanli, Henan Dachao Carbon Energy Technology Co., Ltd., Sinosteel Maanshan General Institute of Mining Research, Aemcn, KBC Corporation, Ltd., Shanghai Tanyuan New Materials Technology Co., Ltd., Zhejiang Apex, Fujian Xinsen Carbon Co., Ltd., Bengbu Gifuli New Materials, Shenzhen Solide New Materials Technology Co., Ltd., Jiangsu PURESTAR Environmental Protection Technology Co., Ltd., etc.

In 2025, the first-tier manufacturers (Shengquan Group, Fujian Yuanli, Henan Dachao Carbon Energy Technology Co., Ltd., SinoSteel Maanshan, Aemcn, Shenzhen Solide) account for approximately 92.15% of total sales volume. With the release of production capacity and the expansion of new entrants, the competitive landscape of the industry will further intensify in the future.

Market Characteristics Summary:

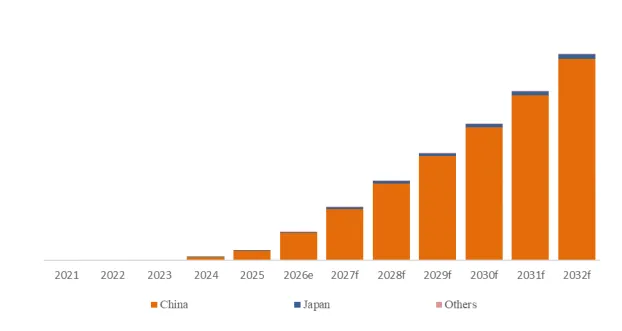
Explosive Market Growth: The rapid development of the new energy industry and the continued growth in demand for high-energy-density batteries are driving the rapid expansion of the global porous carbon market for silicon-carbon batteries. By 2025, the Chinese market will account for approximately 95% of the global total, and will continue to maintain rapid growth over the next three to five years.

Significant Technological Differences: Three major routes—biomass, resin-based, and coke-based—are developing in parallel. The resin-based route boasts high specific surface area, stable performance, and excellent consistency; the coke-based route has a significant cost advantage and great potential for large-scale production; the biomass route offers flexible response and low cost. The coke-based and high-porosity routes have the most prominent growth potential in the future.

Clear Competitive Landscape: The market is dominated by several medium-to-large-sized enterprises, with a moderate concentration and intense competition. Domestic leading companies have established technological barriers through self-developed and joint development, but the market is not monopolized by a few companies, and the production capacity differences among companies are limited.

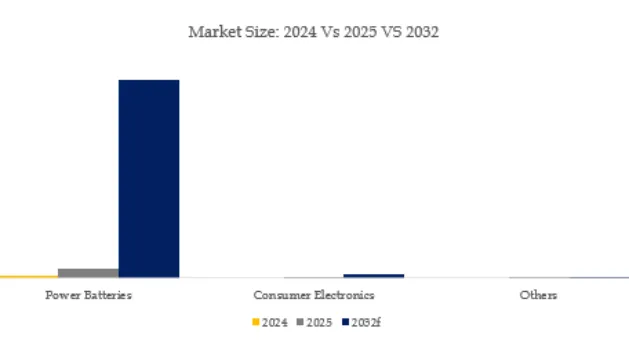
Differentiated Application Scenarios: Power batteries are the core application, accounting for over 97%; consumer electronics and other applications have a smaller share, but significant growth rates (CAGR 40-50%), especially in the mid-to-high-end and wearable device sectors, where they possess potential market value.


Porous Carbon for CVD Silicon-carbon Anodes Market Summary

According to the new market research report “Global Porous Carbon for CVD Silicon-carbon Anodes Market Report 2025-2032″, published by QYResearch, In 2025, the global production of Porous Carbon for CVD Silicon-carbon Anodes was approximately 1,637 tons, with an average price of $32,270 per ton and a gross margin of approximately 24.57%.

Figure00001. Global Porous Carbon for CVD Silicon-carbon Anodes Market Size (US$ Million), 2021-2032

Porous Carbon for CVD Silicon-carbon Anodes

Above data is based on report from QYResearch: Global Porous Carbon for CVD Silicon-carbon Anodes Market Report 2021-2032 (published in 2025). If you need the latest data, plaese contact QYResearch.


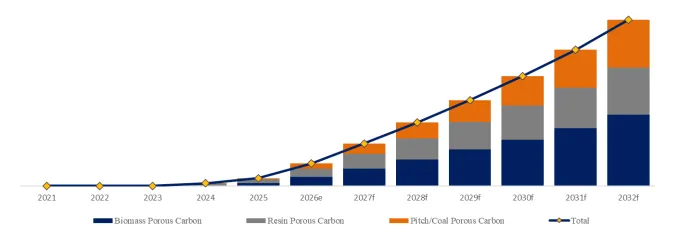
Figure00002. Porous Carbon for CVD Silicon-carbon Anodes, Global Market Size, Split by Product Segment

Porous Carbon for CVD Silicon-carbon Anodes

Based on or includes research from QYResearch: Global Porous Carbon for CVD Silicon-carbon Anodes Market Report 2021-2032.

In terms of product type, currently Resin Porous Carbon is the largest segment, hold a share of 52.67%.

Figure00003. Porous Carbon for CVD Silicon-carbon Anodes, Global Market Size, Split by Application Segment

Porous Carbon for CVD Silicon-carbon Anodes

In terms of product application, currently Power Batteries is the largest segment, hold a share of 96.00%.

Figure00004. Porous Carbon for CVD Silicon-carbon Anodes, Global Market Size, Split by Region

Porous Carbon for CVD Silicon-carbon Anodes

Based on or includes research from QYResearch: Global Porous Carbon for CVD Silicon-carbon Anodes Market Report 2021-2032.

The report provides a detailed analysis of the market size, growth potential, and key trends for each segment. Through detailed analysis, industry players can identify profit opportunities, develop strategies for specific customer segments, and allocate resources effectively.

The Porous Carbon for CVD Silicon-carbon Anodes market is segmented as below:
By Company
Kuraray
Haycarb
Momentum Materials
Shengquan Group
Fujian Yuanli
Henan Dachao Carbon Energy Technology Co., Ltd.
Sinosteel Maanshan General Institute of Mining Research
Aemcn
KBC Corporation, Ltd.
Shanghai Tanyuan New Materials Technology Co., Ltd.
Zhejiang Apex
Fujian Xinsen Carbon Co., Ltd.
Bengbu Gifuli New Materials
Shenzhen Solide New Materials Technology Co., Ltd.
Jiangsu PURESTAR Environmental Protection Technology Co., Ltd.
Guangdong Dowstone Technology Co., Ltd.
Shanghai Putailai New Energy Technology Co., Ltd.
Do-Fluoride New Materials Co., Ltd.
Xuancheng Silike New Materials Co., Ltd.
Jiangxi Binbin New Material Technology Co., Ltd.
Jiangxi Kete Carbon Based New Material Co., Ltd.
Hunan Zhongke Shinzoom Co., Ltd.
Shanghai XFH Technology Co., Ltd.
BTR New Material Group Co., Ltd.
Beihai Sence Carbon Materials Technology Co., Ltd.

Segment by Type
Biomass Porous Carbon
Resin Porous Carbon
Pitch/Coal Porous Carbon

Segment by Application
Power Batteries
Consumer Electronics
Others

Each chapter of the report provides detailed information for readers to further understand the Porous Carbon for CVD Silicon-carbon Anodes market:

Chapter 1: Introduces the report scope of the Porous Carbon for CVD Silicon-carbon Anodes report, global total market size (valve, volume and price). This chapter also provides the market dynamics, latest developments of the market, the driving factors and restrictive factors of the market, the challenges and risks faced by manufacturers in the industry, and the analysis of relevant policies in the industry. (2021-2032)
Chapter 2: Detailed analysis of Porous Carbon for CVD Silicon-carbon Anodes manufacturers competitive landscape, price, sales and revenue market share, latest development plan, merger, and acquisition information, etc. (2021-2026)
Chapter 3: Provides the analysis of various Porous Carbon for CVD Silicon-carbon Anodes market segments by Type, covering the market size and development potential of each market segment, to help readers find the blue ocean market in different market segments. (2021-2032)
Chapter 4: Provides the analysis of various market segments by Application, covering the market size and development potential of each market segment, to help readers find the blue ocean market in different downstream markets.(2021-2032)
Chapter 5: Sales, revenue of Porous Carbon for CVD Silicon-carbon Anodes in regional level. It provides a quantitative analysis of the market size and development potential of each region and introduces the market development, future development prospects, market space, and market size of each country in the world..(2021-2032)
Chapter 6: Sales, revenue of Porous Carbon for CVD Silicon-carbon Anodes in country level. It provides sigmate data by Type, and by Application for each country/region.(2021-2032)
Chapter 7: Provides profiles of key players, introducing the basic situation of the main companies in the market in detail, including product sales, revenue, price, gross margin, product introduction, recent development, etc. (2021-2026)
Chapter 8: Analysis of industrial chain, including the upstream and downstream of the industry.
Chapter 9: Conclusion.

Benefits of purchasing QYResearch report:
Competitive Analysis: QYResearch provides in-depth Porous Carbon for CVD Silicon-carbon Anodes competitive analysis, including information on key company profiles, new entrants, acquisitions, mergers, large market shear, opportunities, and challenges. These analyses provide clients with a comprehensive understanding of market conditions and competitive dynamics, enabling them to develop effective market strategies and maintain their competitive edge.

Industry Analysis: QYResearch provides Porous Carbon for CVD Silicon-carbon Anodes comprehensive industry data and trend analysis, including raw material analysis, market application analysis, product type analysis, market demand analysis, market supply analysis, downstream market analysis, and supply chain analysis.

and trend analysis. These analyses help clients understand the direction of industry development and make informed business decisions.

Market Size: QYResearch provides Porous Carbon for CVD Silicon-carbon Anodes market size analysis, including capacity, production, sales, production value, price, cost, and profit analysis. This data helps clients understand market size and development potential, and is an important reference for business development.

Other relevant reports of QYResearch:
Global Porous Carbon for CVD Silicon-carbon Anodes Sales Market Report, Competitive Analysis and Regional Opportunities 2026-2032
Global Porous Carbon for CVD Silicon-carbon Anodes Market Outlook, In‑Depth Analysis & Forecast to 2032
Global Porous Carbon for CVD Silicon-carbon Anodes Market Research Report 2026

About Us:
QYResearch founded in California, USA in 2007, which is a leading global market research and consulting company. Our primary business include market research reports, custom reports, commissioned research, IPO consultancy, business plans, etc. With over 19 years of experience and a dedicated research team, we are well placed to provide useful information and data for your business, and we have established offices in 7 countries (include United States, Germany, Switzerland, Japan, Korea, China and India) and business partners in over 30 countries. We have provided industrial information services to more than 60,000 companies in over the world.

Contact Us:
If you have any queries regarding this report or if you would like further information, please contact us:
QY Research Inc.
Add: 17890 Castleton Street Suite 369 City of Industry CA 91748 United States
EN: https://www.qyresearch.com
Email: global@qyresearch.com
Tel: 001-626-842-1666(US)
JP: https://www.qyresearch.co.jp
カテゴリー: 未分類 | 投稿者huangsisi 12:31 | コメントをどうぞ

PCB Photosensitive Ink Research:CAGR of 10.6% during the forecast period

QY Research Inc. (Global Market Report Research Publisher) announces the release of 2025 latest report “PCB Photosensitive Ink- Global Market Share and Ranking, Overall Sales and Demand Forecast 2026-2032”. Based on current situation and impact historical analysis (2020-2024) and forecast calculations (2026-2032), this report provides a comprehensive analysis of the global PCB Photosensitive Ink market, including market size, share, demand, industry development status, and forecasts for the next few years.

The global market for PCB Photosensitive Ink was estimated to be worth US$ million in 2024 and is forecast to a readjusted size of US$ million by 2031 with a CAGR of %during the forecast period 2025-2031.

【Get a free sample PDF of this report (Including Full TOC, List of Tables & Figures, Chart)】
https://www.qyresearch.com/reports/3673048/pcb-photosensitive-ink


PCB Photosensitive Ink Market Summary

PCB photosensitive ink is a light curable functional ink used in printed circuit board manufacturing for pattern transfer, solder mask protection, character marking, and fine circuit processing. it is usually formulated with resin, photosensitive monomers, photoinitiators, pigments, fillers, solvents, and functional additives. after printing, coating, prebaking, exposure, development, etching, electroplating, curing, or stripping, it helps form circuit patterns, protect solder pads, provide electrical insulation, improve chemical resistance, and support long term board reliability. by application, pcb photosensitive ink can be divided into photosensitive circuit ink, photosensitive solder mask ink, and photosensitive legend ink. its key performance indicators include resolution, adhesion, etching resistance, electroplating resistance, heat resistance, insulation reliability, development stability, stripping cleanliness, low ionic contamination, and dimensional stability.

The PCB photosensitive ink market is moving toward higher performance, domestic substitution, environmental compliance, and better compatibility with fine line PCB processes. demand from consumer electronics is becoming more stable, while growth from automotive electronics, AI servers, high speed communication equipment, industrial control, mini LED, OLED modules, HDI boards, high layer count PCB, flexible PCB, and semiconductor packaging substrates is raising requirements for high resolution, low ionic residue, high heat resistance, strong adhesion, high insulation reliability, and stable development windows. standard solder mask ink and general purpose circuit ink are facing stronger price competition as supply increases, but high end products for HDI, automotive electronics, high frequency and high speed boards, and packaging substrates still have higher technical barriers and better pricing power. in the future, suppliers with strong formulation development, resin modification, clean production, batch consistency, customer certification, and process support capabilities will gain more opportunities. the market trend is not only driven by volume expansion, but also by product upgrading, green formulations, low VOC systems, halogen free requirements, and closer cooperation between ink suppliers and pcb manufacturers.


Figure00001. PCB Photosensitive Ink Technology Roadmap

PCB Photosensitive Ink

Based on or includes research from QYResearch: Global PCB Photosensitive Ink Market Report 2026-2032.

Figure00002. PCB Photosensitive Ink Industry Chain Diagram

PCB Photosensitive Ink

Based on or includes research from QYResearch: Global PCB Photosensitive Ink Market Report 2026-2032.


According to the new market research report “Global PCB Photosensitive Ink Market Report 2026-2032”, published by QYResearch, the global PCB Photosensitive Ink market size is projected to reach USD 1 billion by 2032, at a CAGR of 10.6% during the forecast period.

Figure00003. Global PCB Photosensitive Ink Market Size (US$ Million), 2021-2032

PCB Photosensitive Ink

Above data is based on report from QYResearch: Global PCB Photosensitive Ink Market Report 2026-2032 (published in 2026). If you need the latest data, plaese contact QYResearch.


Figure00004. Global PCB Photosensitive Ink Top 13 Players Ranking and Market Share (Ranking is based on the revenue of 2025, continually updated)

PCB Photosensitive Ink

Above data is based on report from QYResearch: Global PCB Photosensitive Ink Market Report 2026-2032 (published in 2026). If you need the latest data, plaese contact QYResearch.

According to QYResearch Top Players Research Center, the global key manufacturers of PCB Photosensitive Ink include Taiyo Holdings, Chang Chun Group, Nan Ya Plastics Corporation , Shenzhen RongDa Photosensitive Science & Technology, Resonac, etc. In 2025, the global top five players had a share approximately 56.0% in terms of revenue.


Key driving factors the upgrade of the pcb industry toward hdi boards, high layer count pcb, flexible pcb, automotive electronics boards, server boards, and package substrates is driving pcb photosensitive ink toward higher resolution, stronger adhesion, better heat resistance, higher insulation reliability, lower ionic residue, and more stable development performance. stable demand from consumer electronics, communication equipment, automotive electronics, ai servers, industrial control equipment, and new energy electronics continues to support the consumption of photosensitive solder mask ink, photosensitive circuit ink, and photosensitive legend ink. domestic substitution is accelerating as pcb manufacturers pay more attention to supply chain security, delivery stability, and cost control. environmental regulations and green manufacturing requirements are also promoting low voc, halogen free, low odor, low migration, and low pollution formulation upgrades. in addition, more refined exposure, development, etching, electroplating, and curing processes require ink suppliers to provide products and technical services that better match customer process windows.

Key restraints the certification cycle for high end pcb photosensitive ink is relatively long, especially in automotive electronics, high frequency and high speed boards, hdi boards, package substrates, and high layer count pcb applications, where customers have strict requirements for thermal shock resistance, moisture and heat resistance, insulation reliability, caf resistance, adhesion, resolution, development residue, and ionic cleanliness. new entrants face difficulty in quickly replacing established suppliers. upstream high performance resins, photoinitiators, functional additives, and some high purity materials still have technical barriers, while formulation stability and batch consistency require strong research, production, and quality control capabilities. in the mid to low end market, standard solder mask ink and general purpose circuit ink face intense competition and pricing pressure, which can compress gross margins. downstream pcb manufacturers also have strong bargaining power and often require suppliers to support credit terms, fast delivery, product certification, technical service, and customized development. rising requirements for environmental compliance, waste liquid treatment, safety production, and chemical management may further increase operating costs.

Industry development opportunities future opportunities will mainly come from high end pcb material localization and product structure upgrading. hdi, mini led backplanes, oled modules, fpc, automotive pcb, ai servers, high speed communication equipment, and semiconductor package substrates will increase demand for high resolution, low shrinkage, high heat resistance, high insulation, low ionic residue, low roughness, and high reliability photosensitive ink. domestic companies can gradually enter medium to high end supply chains by jointly developing products with major pcb manufacturers, shortening certification cycles, improving batch stability, and strengthening technical service capabilities. green and environmentally friendly formulations also create opportunities for low voc, halogen free, low odor, water based, and low solvent systems. in terms of process adaptation, spray coating, roller coating, ldi exposure, high precision development, and automated inspection will push ink suppliers to evolve from pure material suppliers into providers of formulation and process solutions. meanwhile, overseas supply chain uncertainty and customer cost reduction demand will continue to promote domestic substitution, creating long term growth opportunities for companies with strong research, scaled production, and major customer certification capabilities.

The report provides a detailed analysis of the market size, growth potential, and key trends for each segment. Through detailed analysis, industry players can identify profit opportunities, develop strategies for specific customer segments, and allocate resources effectively.

The PCB Photosensitive Ink market is segmented as below:
By Company
Taiyo Ink
Onstatic Technology
Tamura Corporation
Advance Materials Corporation
Shenzhen Rongda Photosensitive&Technology
Jiangsu Kuangshun Photosensitivity New-material Stock
New East New Materials

Segment by Type
PCB Photosensitive Circuit Ink
PCB Photosensitive Solder Resist Ink
PCB Photosensitive Marking Ink

Segment by Application
Single Board
Double Board
Multilayer Board

Each chapter of the report provides detailed information for readers to further understand the PCB Photosensitive Ink market:

Chapter 1: Introduces the report scope of the PCB Photosensitive Ink report, global total market size (valve, volume and price). This chapter also provides the market dynamics, latest developments of the market, the driving factors and restrictive factors of the market, the challenges and risks faced by manufacturers in the industry, and the analysis of relevant policies in the industry. (2021-2032)
Chapter 2: Detailed analysis of PCB Photosensitive Ink manufacturers competitive landscape, price, sales and revenue market share, latest development plan, merger, and acquisition information, etc. (2021-2026)
Chapter 3: Provides the analysis of various PCB Photosensitive Ink market segments by Type, covering the market size and development potential of each market segment, to help readers find the blue ocean market in different market segments. (2021-2032)
Chapter 4: Provides the analysis of various market segments by Application, covering the market size and development potential of each market segment, to help readers find the blue ocean market in different downstream markets.(2021-2032)
Chapter 5: Sales, revenue of PCB Photosensitive Ink in regional level. It provides a quantitative analysis of the market size and development potential of each region and introduces the market development, future development prospects, market space, and market size of each country in the world..(2021-2032)
Chapter 6: Sales, revenue of PCB Photosensitive Ink in country level. It provides sigmate data by Type, and by Application for each country/region.(2021-2032)
Chapter 7: Provides profiles of key players, introducing the basic situation of the main companies in the market in detail, including product sales, revenue, price, gross margin, product introduction, recent development, etc. (2021-2026)
Chapter 8: Analysis of industrial chain, including the upstream and downstream of the industry.
Chapter 9: Conclusion.

Benefits of purchasing QYResearch report:
Competitive Analysis: QYResearch provides in-depth PCB Photosensitive Ink competitive analysis, including information on key company profiles, new entrants, acquisitions, mergers, large market shear, opportunities, and challenges. These analyses provide clients with a comprehensive understanding of market conditions and competitive dynamics, enabling them to develop effective market strategies and maintain their competitive edge.

Industry Analysis: QYResearch provides PCB Photosensitive Ink comprehensive industry data and trend analysis, including raw material analysis, market application analysis, product type analysis, market demand analysis, market supply analysis, downstream market analysis, and supply chain analysis.

and trend analysis. These analyses help clients understand the direction of industry development and make informed business decisions.

Market Size: QYResearch provides PCB Photosensitive Ink market size analysis, including capacity, production, sales, production value, price, cost, and profit analysis. This data helps clients understand market size and development potential, and is an important reference for business development.

Other relevant reports of QYResearch:
Global PCB Photosensitive Ink Sales Market Report, Competitive Analysis and Regional Opportunities 2025-2031
Global PCB Photosensitive Ink Market Outlook, In‑Depth Analysis & Forecast to 2031
Global PCB Photosensitive Ink Market Research Report 2025

About Us:
QYResearch founded in California, USA in 2007, which is a leading global market research and consulting company. Our primary business include market research reports, custom reports, commissioned research, IPO consultancy, business plans, etc. With over 19 years of experience and a dedicated research team, we are well placed to provide useful information and data for your business, and we have established offices in 7 countries (include United States, Germany, Switzerland, Japan, Korea, China and India) and business partners in over 30 countries. We have provided industrial information services to more than 60,000 companies in over the world.

Contact Us:
If you have any queries regarding this report or if you would like further information, please contact us:
QY Research Inc.
Add: 17890 Castleton Street Suite 369 City of Industry CA 91748 United States
EN: https://www.qyresearch.com
Email: global@qyresearch.com
Tel: 001-626-842-1666(US)
JP: https://www.qyresearch.co.jp
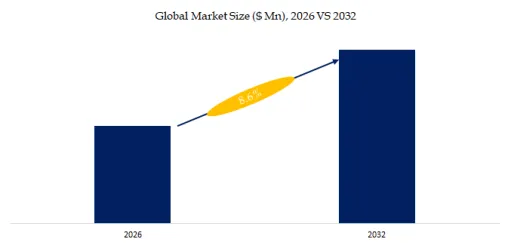
カテゴリー: 未分類 | 投稿者huangsisi 12:30 | コメントをどうぞ

Managed IP VPN Research:worth approximately US$28.248 billion

QY Research Inc. (Global Market Report Research Publisher) announces the release of 2025 latest report “Managed IP VPN- Global Market Share and Ranking, Overall Sales and Demand Forecast 2026-2032”. Based on current situation and impact historical analysis (2020-2024) and forecast calculations (2026-2032), this report provides a comprehensive analysis of the global Managed IP VPN market, including market size, share, demand, industry development status, and forecasts for the next few years.

The global market for Managed IP VPN was estimated to be worth US$ 878 million in 2023 and is forecast to a readjusted size of US$ 1399.6 million by 2030 with a CAGR of 6.8% during the forecast period 2024-2030

【Get a free sample PDF of this report (Including Full TOC, List of Tables & Figures, Chart)】
https://www.qyresearch.com/reports/2347845/managed-ip-vpn


Managed IP VPN Product Overview

Managed IP VPN services enable users to manage and monitor their organization’s network, and provide a complete view of the network. Service providers help enterprises manage the end points of the network, and notify users whenever a threat is detected. Moreover, enterprises can access a portal where all the activities of the network, such as performance reporting, network health monitoring, service management, and SLA management are reported, which makes management of the network easier. Furthermore, managed services help organizations in the optimum utilization of all the resources, which increases the efficiency of the organization. The global Managed IP VPN gross margin is projected to be approximately 60% by 2025.

The major players in global Managed IP VPN market include Orange Business Services, AT&T, Verizon Communication, etc. The top 3 players occupy about 35% shares of the global market. North America and Europe are main markets, they occupy about 65% of the global market. Site-to-site VPN is the main type, with a share about 75%. BFSI & Healthcare is the main application, which holds a share about 40%. The global enterprise-grade hosted VPN market is experiencing rapid growth, with the widespread adoption of remote work, cross-border branch offices, and cloud services significantly driving demand for VPNs with high availability, security, and manageability. Large telecommunications and network service providers continue to invest in cloud hosting, SD-WAN, and Secure Access Service Edge (SASE) technologies to meet enterprises’ requirements for centralized management and compliance. Meanwhile, the rising demand for flexible, low-cost cloud VPN solutions from the small and medium-sized enterprise (SME) market presents new growth opportunities for vendors. However, the market still faces risks such as evolving cybersecurity threats, intense competition in service pricing, and cross-border compliance challenges.

The leading global providers include Orange Business Services, AT&T, Verizon Communication, Cisco Systems, BT Group PLC, Vodafone Group, NTT Corporation, Lumen Technologies (formerly CenturyLink), Telefonica, and Tata Communications.


Managed IP VPN Market Summary

According to the new market research report “Global Managed IP VPN Market Report 2025-2032″, published by QYResearch, In 2025, The global Managed IP VPN market is worth approximately US$28.248 billion.

Figure00001. Global Managed IP VPN Market Size (US$ Million), 2021-2032

 Managed IP VPN

Above data is based on report from QYResearch: Global Managed IP VPN Market Report 2021-2032 (published in 2025). If you need the latest data, plaese contact QYResearch.


Figure00002. Managed IP VPN, Global Market Size, Split by Product Segment

 Managed IP VPN

Based on or includes research from QYResearch: Global Managed IP VPN Market Report 2021-2032.

In terms of product type, currently Site-to-site VPN is the largest segment, hold a share of 75.6%.

Figure00003. Managed IP VPN, Global Market Size, Split by Application Segment

 Managed IP VPN

In terms of product application, currently BFSI, Healthcare is the largest segment, hold a share of 42.8%.

Figure00004. Managed IP VPN, Global Market Size, Split by Region

 Managed IP VPN

Based on or includes research from QYResearch: Global Managed IP VPN Market Report 2021-2032.

The report provides a detailed analysis of the market size, growth potential, and key trends for each segment. Through detailed analysis, industry players can identify profit opportunities, develop strategies for specific customer segments, and allocate resources effectively.

The Managed IP VPN market is segmented as below:
By Company
Orange Business Services
AT&T
Verizon Communication
Cisco Systems
BT Group PLC
Vodafone Group
NTT Corporation
CenturyLink
Telefonica
Tata Communications

Segment by Type
Remote Access VPN
Site-to-site VPN

Segment by Application
BFSI, Healthcare
IT and Media
Transportation
Manufacturing, Energy
Other

Each chapter of the report provides detailed information for readers to further understand the Managed IP VPN market:

Chapter 1: Introduces the report scope of the Managed IP VPN report, global total market size (valve, volume and price). This chapter also provides the market dynamics, latest developments of the market, the driving factors and restrictive factors of the market, the challenges and risks faced by manufacturers in the industry, and the analysis of relevant policies in the industry. (2021-2032)
Chapter 2: Detailed analysis of Managed IP VPN manufacturers competitive landscape, price, sales and revenue market share, latest development plan, merger, and acquisition information, etc. (2021-2026)
Chapter 3: Provides the analysis of various Managed IP VPN market segments by Type, covering the market size and development potential of each market segment, to help readers find the blue ocean market in different market segments. (2021-2032)
Chapter 4: Provides the analysis of various market segments by Application, covering the market size and development potential of each market segment, to help readers find the blue ocean market in different downstream markets.(2021-2032)
Chapter 5: Sales, revenue of Managed IP VPN in regional level. It provides a quantitative analysis of the market size and development potential of each region and introduces the market development, future development prospects, market space, and market size of each country in the world..(2021-2032)
Chapter 6: Sales, revenue of Managed IP VPN in country level. It provides sigmate data by Type, and by Application for each country/region.(2021-2032)
Chapter 7: Provides profiles of key players, introducing the basic situation of the main companies in the market in detail, including product sales, revenue, price, gross margin, product introduction, recent development, etc. (2021-2026)
Chapter 8: Analysis of industrial chain, including the upstream and downstream of the industry.
Chapter 9: Conclusion.

Benefits of purchasing QYResearch report:
Competitive Analysis: QYResearch provides in-depth Managed IP VPN competitive analysis, including information on key company profiles, new entrants, acquisitions, mergers, large market shear, opportunities, and challenges. These analyses provide clients with a comprehensive understanding of market conditions and competitive dynamics, enabling them to develop effective market strategies and maintain their competitive edge.

Industry Analysis: QYResearch provides Managed IP VPN comprehensive industry data and trend analysis, including raw material analysis, market application analysis, product type analysis, market demand analysis, market supply analysis, downstream market analysis, and supply chain analysis.

and trend analysis. These analyses help clients understand the direction of industry development and make informed business decisions.

Market Size: QYResearch provides Managed IP VPN market size analysis, including capacity, production, sales, production value, price, cost, and profit analysis. This data helps clients understand market size and development potential, and is an important reference for business development.

Other relevant reports of QYResearch:
Global Managed IP VPN Market Insights, Forecast to 2030
Global Managed IP VPN Market Research Report 2024

About Us:
QYResearch founded in California, USA in 2007, which is a leading global market research and consulting company. Our primary business include market research reports, custom reports, commissioned research, IPO consultancy, business plans, etc. With over 19 years of experience and a dedicated research team, we are well placed to provide useful information and data for your business, and we have established offices in 7 countries (include United States, Germany, Switzerland, Japan, Korea, China and India) and business partners in over 30 countries. We have provided industrial information services to more than 60,000 companies in over the world.

Contact Us:
If you have any queries regarding this report or if you would like further information, please contact us:
QY Research Inc.
Add: 17890 Castleton Street Suite 369 City of Industry CA 91748 United States
EN: https://www.qyresearch.com
Email: global@qyresearch.com
Tel: 001-626-842-1666(US)
JP: https://www.qyresearch.co.jp
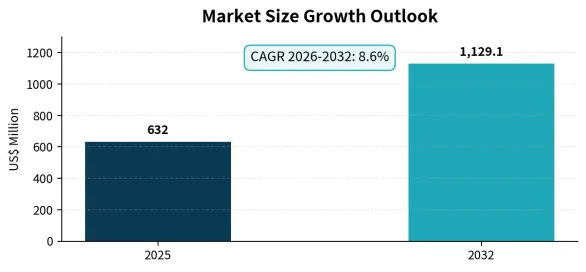
カテゴリー: 未分類 | 投稿者huangsisi 12:16 | コメントをどうぞ

Intelligent Interactive All-in-One Research:Market Report 2025-2031 (published in 2025)

QY Research Inc. (Global Market Report Research Publisher) announces the release of 2025 latest report “Intelligent Interactive All-in-One- Global Market Share and Ranking, Overall Sales and Demand Forecast 2026-2032”. Based on current situation and impact historical analysis (2020-2024) and forecast calculations (2026-2032), this report provides a comprehensive analysis of the global Intelligent Interactive All-in-One market, including market size, share, demand, industry development status, and forecasts for the next few years.

The global market for Intelligent Interactive All-in-One was estimated to be worth US$ million in 2024 and is forecast to a readjusted size of US$ million by 2031 with a CAGR of %during the forecast period 2025-2031.

【Get a free sample PDF of this report (Including Full TOC, List of Tables & Figures, Chart)】
https://www.qyresearch.com/reports/4546848/intelligent-interactive-all-in-one


Intelligent Interactive All-in-One Market Summary

Intelligent Interactive All-in-One refers to an integrated intelligent terminal that combines a virtual digital human avatar with AI software, computing hardware, and interactive peripherals into a single device, enabling real-time human–machine interaction for service and engagement scenarios. Typically equipped with displays, cameras, microphones, speakers, edge computing units, and AI engines, it supports voice, vision, and multi-modal interaction. Intelligent Interactive All-in-One systems are widely deployed in government services, enterprises, healthcare, tourism, retail, and transportation environments to provide consultation, guidance, customer service, and automated service delivery in a standardized, easy-to-deploy form factor.


In 2025, global Intelligent Interactive All-in-One approximately 103,577units, with an average global market price of around US$ 5192 per unit. Gross margin is about 43%. A Intelligent Interactive All-in-One is an intelligent device that highly integrates a digital human image engine, voice interaction, AI inference, display terminal, and computing hardware. It enables real-time digital human display, dialogue interaction, content broadcasting, and business services, and is typically deployed as a floor-standing large screen, interactive terminal, or cabinet-style device. The upstream mainly includes AI large-scale models and digital human driving engines, speech recognition and synthesis technology, graphics rendering and chip computing power, display modules, and complete machine manufacturing. Downstream applications are widely used in government service halls, bank and telecom operator branches, retail and commercial complexes, exhibitions, cultural tourism scenarios, and enterprise services for intelligent navigation, customer service consultation, brand communication, and digital service upgrades.


Figure00001. Global Intelligent Interactive All-in-One Market Size (US$ Million), 2020, 2025, 2031

Intelligent Interactive All-in-One

Above data is based on report from QYResearch: Global Intelligent Interactive All-in-One Market Report 2025-2031 (published in 2025). If you need the latest data, plaese contact QYResearch.


Figure00002. Global Intelligent Interactive All-in-One Top 25 Players Ranking and Market Share (Ranking is based on the revenue of 2025, continually updated)

Intelligent Interactive All-in-One

Above data is based on report from QYResearch: Global Intelligent Interactive All-in-One Market Report 2025-2031 (published in 2025). If you need the latest data, plaese contact QYResearch.

This report profiles top5 players of Intelligent Interactive All-in-One is SEIYO Technology, AISpeech, iFLYTEK, UneeQ, ForteAI.

In 2025, the global top five Intelligent Interactive All-in-One players account for 39.17% of market share in terms of revenue. Above figure shows the key players ranked by revenue in Intelligent Interactive All-in-One.


Figure00003. Intelligent Interactive All-in-One, Global Market Size, Split by Product Segment

Intelligent Interactive All-in-One

Based on or includes research from QYResearch: Global Intelligent Interactive All-in-One Market Report 2025-2031.

In terms of Local Deployment, Local Deployment is the largest segment, hold a share of 72.63%,

Figure00004. Intelligent Interactive All-in-One, Global Market Size, Split by Application Segment

Intelligent Interactive All-in-One

Based on or includes research from QYResearch: Global Intelligent Interactive All-in-One Market Report 2025-2031.


In terms of product application, Intelligent Office is the largest application, hold a share of 29.14%,


Intelligent Interactive All-in-One, Industry Trends

1. Evolution from “Demonstration-Oriented” to “Service-Oriented Digital Employees”: Virtual digital humans will evolve from simple announcements and visual displays to “digital employees” with business understanding and execution capabilities. They will be able to undertake practical service functions such as consultation, processing, marketing, and training, significantly improving service efficiency and consistency.
2. Deeply Driven by Large Models, Rapidly Enhancing Intelligence: The integration of general and industry-specific large models enables digital humans to possess stronger natural language understanding, contextual memory, and complex task processing capabilities, achieving a more natural and human-like multi-turn interactive experience.
3. Hardware-Software Integration Becomes the Mainstream Delivery Form: Virtual digital humans are accelerating their deep integration with hardware such as computing modules, cameras, microphones, and touchscreens, delivered in an “all-in-one” form, lowering deployment barriers, shortening implementation cycles, and facilitating large-scale replication.
4. Comprehensive Enhancement of Multimodal Interaction Capabilities: Integrating multimodal interaction methods such as voice, vision, gestures, facial expressions, and touch, digital humans can adapt to complex offline environments, enhancing user immersion and realism, and meeting the high-requirement scenarios of government, finance, and retail.
5. Deepening Industry and Scenario-Based Applications: Digital humans will be deeply customized for industries such as government services, financial institutions, retail, cultural tourism and exhibitions, and medical consultations, forming standardized solutions of “industry templates + scenario applications.”
6. Parallel Development of Cloud-Edge Collaboration and Local Deployment: In scenarios with high data security and real-time requirements, local deployment and edge computing power will become important trends, while continuously collaborating with cloud models to achieve a balance between performance and security.
7. Continuously Decreasing Content Production and Maintenance Costs: With the maturity of modeling, training, and generation tools, the costs of creating, updating, and maintaining digital humans are continuously decreasing, driving virtual digital humans from pilot applications to large-scale commercial use.

The report provides a detailed analysis of the market size, growth potential, and key trends for each segment. Through detailed analysis, industry players can identify profit opportunities, develop strategies for specific customer segments, and allocate resources effectively.

The Intelligent Interactive All-in-One market is segmented as below:
By Company
Shiyou Technology
AISpeech Technology
Iflytek
Hongmianxiaobing Technology
Huawei
Thunder Software Technology
Shuozhi Information Technology
Mkios Smart Connectivity
Mofa Information Technology
Sensetime Technology Development
Baidu
JD
Fengping Intelligent Technology
A Little Like Technology

Segment by Type
Vertical Screen
Horizontal Screen
Holographic Screen
Other

Segment by Application
Intelligent Finance
Intelligent Tourism
Intelligent Media
Intelligent Office
Intelligent Medical
Others

Each chapter of the report provides detailed information for readers to further understand the Intelligent Interactive All-in-One market:

Chapter 1: Introduces the report scope of the Intelligent Interactive All-in-One report, global total market size (valve, volume and price). This chapter also provides the market dynamics, latest developments of the market, the driving factors and restrictive factors of the market, the challenges and risks faced by manufacturers in the industry, and the analysis of relevant policies in the industry. (2021-2032)
Chapter 2: Detailed analysis of Intelligent Interactive All-in-One manufacturers competitive landscape, price, sales and revenue market share, latest development plan, merger, and acquisition information, etc. (2021-2026)
Chapter 3: Provides the analysis of various Intelligent Interactive All-in-One market segments by Type, covering the market size and development potential of each market segment, to help readers find the blue ocean market in different market segments. (2021-2032)
Chapter 4: Provides the analysis of various market segments by Application, covering the market size and development potential of each market segment, to help readers find the blue ocean market in different downstream markets.(2021-2032)
Chapter 5: Sales, revenue of Intelligent Interactive All-in-One in regional level. It provides a quantitative analysis of the market size and development potential of each region and introduces the market development, future development prospects, market space, and market size of each country in the world..(2021-2032)
Chapter 6: Sales, revenue of Intelligent Interactive All-in-One in country level. It provides sigmate data by Type, and by Application for each country/region.(2021-2032)
Chapter 7: Provides profiles of key players, introducing the basic situation of the main companies in the market in detail, including product sales, revenue, price, gross margin, product introduction, recent development, etc. (2021-2026)
Chapter 8: Analysis of industrial chain, including the upstream and downstream of the industry.
Chapter 9: Conclusion.

Benefits of purchasing QYResearch report:
Competitive Analysis: QYResearch provides in-depth Intelligent Interactive All-in-One competitive analysis, including information on key company profiles, new entrants, acquisitions, mergers, large market shear, opportunities, and challenges. These analyses provide clients with a comprehensive understanding of market conditions and competitive dynamics, enabling them to develop effective market strategies and maintain their competitive edge.

Industry Analysis: QYResearch provides Intelligent Interactive All-in-One comprehensive industry data and trend analysis, including raw material analysis, market application analysis, product type analysis, market demand analysis, market supply analysis, downstream market analysis, and supply chain analysis.

and trend analysis. These analyses help clients understand the direction of industry development and make informed business decisions.

Market Size: QYResearch provides Intelligent Interactive All-in-One market size analysis, including capacity, production, sales, production value, price, cost, and profit analysis. This data helps clients understand market size and development potential, and is an important reference for business development.

Other relevant reports of QYResearch:
Global Intelligent Interactive All-in-One Market Outlook, In‑Depth Analysis & Forecast to 2031
Global Intelligent Interactive All-in-One Sales Market Report, Competitive Analysis and Regional Opportunities 2025-2031
Global Intelligent Interactive All-in-One Market Research Report 2025

About Us:
QYResearch founded in California, USA in 2007, which is a leading global market research and consulting company. Our primary business include market research reports, custom reports, commissioned research, IPO consultancy, business plans, etc. With over 19 years of experience and a dedicated research team, we are well placed to provide useful information and data for your business, and we have established offices in 7 countries (include United States, Germany, Switzerland, Japan, Korea, China and India) and business partners in over 30 countries. We have provided industrial information services to more than 60,000 companies in over the world.

Contact Us:
If you have any queries regarding this report or if you would like further information, please contact us:
QY Research Inc.
Add: 17890 Castleton Street Suite 369 City of Industry CA 91748 United States
EN: https://www.qyresearch.com
Email: global@qyresearch.com
Tel: 001-626-842-1666(US)
JP: https://www.qyresearch.co.jp
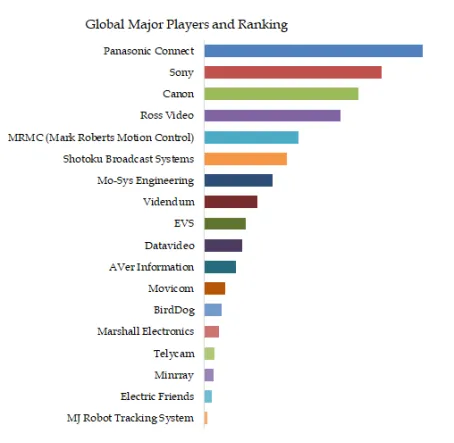
カテゴリー: 未分類 | 投稿者huangsisi 12:15 | コメントをどうぞ

Identity Authentication Card Research:CAGR of 12.36% during the forecast period

Identity Authentication Card Research:CAGR of 12.36% during the forecast per

QY Research Inc. (Global Market Report Research Publisher) announces the release of 2025 latest report “Identity Authentication Card- Global Market Share and Ranking, Overall Sales and Demand Forecast 2026-2032”. Based on current situation and impact historical analysis (2020-2024) and forecast calculations (2026-2032), this report provides a comprehensive analysis of the global Identity Authentication Card market, including market size, share, demand, industry development status, and forecasts for the next few years.

The global market for Identity Authentication Card was estimated to be worth US$ 1030 million in 2025 and is projected to reach US$ 2530 million, growing at a CAGR of 12.4% from 2026 to 2032.

【Get a free sample PDF of this report (Including Full TOC, List of Tables & Figures, Chart)】
https://www.qyresearch.com/reports/6004305/identity-authentication-card


Identity Authentication Card Market Summary

According to the new market research report “Global Identity Authentication Card Market Report 2025-2031″, published by QYResearch, the global Identity Authentication Card market size is projected to grow from USD 1029.78 million in 2025 to USD 2530 million by 2032, at a CAGR of 12.36% during the forecast period.

A Digital Identity refers to a set of electronically stored and managed identity attributes that uniquely represent an individual, organization, or device in digital systems. It enables secure identification, authentication, and authorization across online and offline environments through technologies such as biometrics, cryptography, blockchain, and public key infrastructure (PKI). Digital identity serves as the foundational infrastructure for digital governance, digital economy, and smart services.


Figure00001. Global Identity Authentication Card Market Size (US$ Million), 2020, 2025, 2031

Identity Authentication Card

Above data is based on report from QYResearch: Global Identity Authentication Card Market Report 2025-2031 (published in 2025). If you need the latest data, plaese contact QYResearch.

Figure00002. Global Identity Authentication Card Top 17 Players Ranking and Market Share (Ranking is based on the revenue of 2025, continually updated)

Identity Authentication Card

Above data is based on report from QYResearch: Global Identity Authentication Card Market Report 2025-2031 (published in 2025). If you need the latest data, plaese contact QYResearch.

This report profiles top5 players of Identity Authentication Card is Siemens, Gemalto, Entrust Datacard, HID Global, IDEMIA.

In 2025, the global top five Identity Authentication Card players account for 42.39% of market share in terms of revenue. Above figure shows the key players ranked by revenue in Identity Authentication Card.


Figure00003. Identity Authentication Card, Global Market Size, Split by Product Segment

Identity Authentication Card

Based on or includes research from QYResearch: Global Identity Authentication Card Market Report 2025-2031.

In terms of type, Biometric is the largest segment, hold a share of 78.26%,

Figure00004. Identity Authentication Card, Global Market Size, Split by Application Segment

Identity Authentication Card

Based on or includes research from QYResearch: Global Identity Authentication Card Market Report 2025-2031.


In terms of product application, Government is the largest application, hold a share of 72.13%,

Identity Authentication Card, Industry Trends

Biometric-based Digital ID Biometric Identity Authentication Cards (using fingerprint, face, iris, or multimodal biometrics) are becoming the dominant solution globally. Governments prefer biometric IDs because they provide stronger identity assurance, reduce fraud, and enable one-person-one-ID systems. In most national ID programs, biometric-based systems account for 70–85% of total deployments, while non-biometric solutions are mainly used in low-security or temporary identity scenarios.
Multi-modal Biometrics Adoption Accelerates Instead of relying on a single biometric trait, digital ID systems increasingly integrate multiple biometrics such as face + fingerprint or face + iris. This improves matching accuracy, reduces false acceptance rates, and ensures usability across different populations and age groups.
Shift from Physical Cards to Mobile Digital IDs Identity Authentication Cards are transitioning from physical smart cards to mobile-based digital IDs stored in smartphones and cloud wallets. Mobile digital ID allows real-time authentication, remote verification, and cross-platform integration with banking, healthcare, travel, and e-government services.
Privacy Protection and Zero-Trust Architecture Strengthen With stricter data protection regulations (GDPR, eIDAS 2.0, etc.), digital ID systems adopt privacy-by-design frameworks, including encrypted biometric templates, decentralized identity (DID), and selective disclosure mechanisms. Users increasingly control what personal data is shared and with whom.
Interoperability and Cross-Border Recognition Expand Governments and regional alliances are pushing for interoperable digital identity frameworks. Cross-border digital IDs are becoming essential for international travel, immigration, cross-border banking, and global workforce mobility.
AI-driven Identity Verification Becomes Standard AI is widely used for liveness detection, deepfake prevention, facial recognition accuracy improvement, and real-time risk scoring. This enhances both security and user experience in digital onboarding and authentication.


The report provides a detailed analysis of the market size, growth potential, and key trends for each segment. Through detailed analysis, industry players can identify profit opportunities, develop strategies for specific customer segments, and allocate resources effectively.

The Identity Authentication Card market is segmented as below:
By Company
LSG Sky Chefs
Gategroup
DNATA
SATS Ltd.
En Route International
AMI Inflight
Kaelis
deSter
W.K. Thomas
DO & CO
Newrest Group
Flying Food Group
Emirates Flight Catering
Qatar Aircraft Catering Company
Saudia Catering
Servair
Evergreen Sky Catering
Bangkok Air Catering
BAC Group
Sojitz Royal In-flight Catering Co., Ltd.
JAL Royal Catering Co., Ltd.
China Air Catering Group Co., Ltd.
China Southern Airlines Air Catering Co., Ltd.
Eastern Air Catering Co., Ltd
Beijing Airport Inflight Kitchen Co., Ltd.
Baiyun Airport Air Catering Co., Ltd.
Shenzhen Airlines Catering Co., Ltd.
Hainan Airlines Catering Co., Ltd.
Xiamen Airlines Catering Co., Ltd.
Chengdu Air Catering Co., Ltd.
Kunming Air Catering Co., Ltd.

Segment by Type
Contact Type
Non-contact Type

Segment by Application
BFSI
Government & Public Utilities
Transportation
Others

Each chapter of the report provides detailed information for readers to further understand the Identity Authentication Card market:

Chapter 1: Introduces the report scope of the Identity Authentication Card report, global total market size (valve, volume and price). This chapter also provides the market dynamics, latest developments of the market, the driving factors and restrictive factors of the market, the challenges and risks faced by manufacturers in the industry, and the analysis of relevant policies in the industry. (2021-2032)
Chapter 2: Detailed analysis of Identity Authentication Card manufacturers competitive landscape, price, sales and revenue market share, latest development plan, merger, and acquisition information, etc. (2021-2026)
Chapter 3: Provides the analysis of various Identity Authentication Card market segments by Type, covering the market size and development potential of each market segment, to help readers find the blue ocean market in different market segments. (2021-2032)
Chapter 4: Provides the analysis of various market segments by Application, covering the market size and development potential of each market segment, to help readers find the blue ocean market in different downstream markets.(2021-2032)
Chapter 5: Sales, revenue of Identity Authentication Card in regional level. It provides a quantitative analysis of the market size and development potential of each region and introduces the market development, future development prospects, market space, and market size of each country in the world..(2021-2032)
Chapter 6: Sales, revenue of Identity Authentication Card in country level. It provides sigmate data by Type, and by Application for each country/region.(2021-2032)
Chapter 7: Provides profiles of key players, introducing the basic situation of the main companies in the market in detail, including product sales, revenue, price, gross margin, product introduction, recent development, etc. (2021-2026)
Chapter 8: Analysis of industrial chain, including the upstream and downstream of the industry.
Chapter 9: Conclusion.

Benefits of purchasing QYResearch report:
Competitive Analysis: QYResearch provides in-depth Identity Authentication Card competitive analysis, including information on key company profiles, new entrants, acquisitions, mergers, large market shear, opportunities, and challenges. These analyses provide clients with a comprehensive understanding of market conditions and competitive dynamics, enabling them to develop effective market strategies and maintain their competitive edge.

Industry Analysis: QYResearch provides Identity Authentication Card comprehensive industry data and trend analysis, including raw material analysis, market application analysis, product type analysis, market demand analysis, market supply analysis, downstream market analysis, and supply chain analysis.

and trend analysis. These analyses help clients understand the direction of industry development and make informed business decisions.

Market Size: QYResearch provides Identity Authentication Card market size analysis, including capacity, production, sales, production value, price, cost, and profit analysis. This data helps clients understand market size and development potential, and is an important reference for business development.

Other relevant reports of QYResearch:
Global Identity Authentication Card Sales Market Report, Competitive Analysis and Regional Opportunities 2026-2032
Global Identity Authentication Card Market Outlook, In‑Depth Analysis & Forecast to 2032
Global Identity Authentication Card Market Research Report 2026

About Us:
QYResearch founded in California, USA in 2007, which is a leading global market research and consulting company. Our primary business include market research reports, custom reports, commissioned research, IPO consultancy, business plans, etc. With over 19 years of experience and a dedicated research team, we are well placed to provide useful information and data for your business, and we have established offices in 7 countries (include United States, Germany, Switzerland, Japan, Korea, China and India) and business partners in over 30 countries. We have provided industrial information services to more than 60,000 companies in over the world.

Contact Us:
If you have any queries regarding this report or if you would like further information, please contact us:
QY Research Inc.
Add: 17890 Castleton Street Suite 369 City of Industry CA 91748 United States
EN: https://www.qyresearch.com
Email: global@qyresearch.com
Tel: 001-626-842-1666(US)
JP: https://www.qyresearch.co.jp
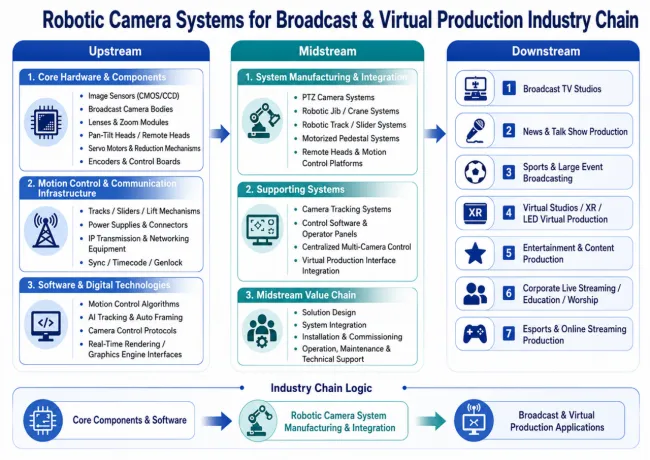
iod

カテゴリー: 未分類 | 投稿者huangsisi 12:13 | コメントをどうぞ