QY Research Inc. (Global Market Report Research Publisher) announces the release of 2025 latest report “BOPP Capacitor Film- Global Market Share and Ranking, Overall Sales and Demand Forecast 2026-2032”. Based on current situation and impact historical analysis (2020-2024) and forecast calculations (2026-2032), this report provides a comprehensive analysis of the global BOPP Capacitor Film market, including market size, share, demand, industry development status, and forecasts for the next few years.
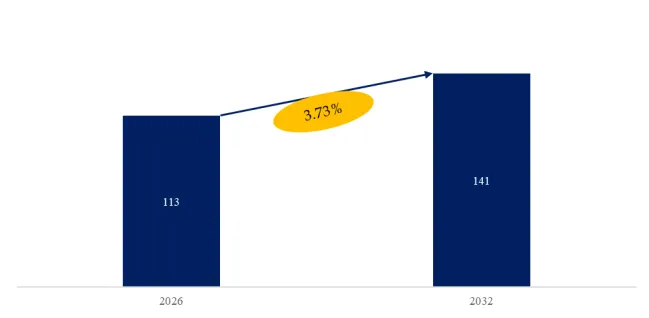
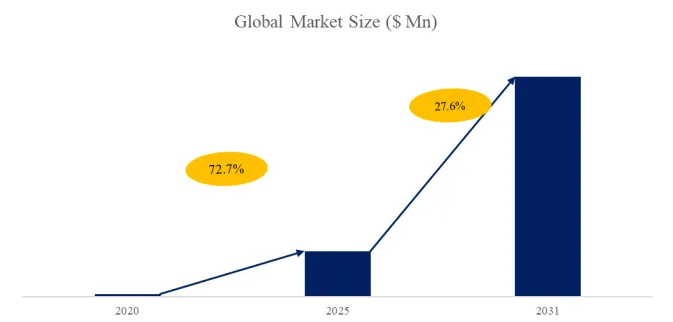
The global market for BOPP Capacitor Film was estimated to be worth US$ 1,029.30 million in 2025 and is projected to reach US$ 1,621.46 million, growing at a CAGR of 6.77% from 2026 to 2032.
【Get a free sample PDF of this report (Including Full TOC, List of Tables & Figures, Chart)】
https://www.qyresearch.com/reports/5509172/bopp-capacitor-film
BOPP Capacitor Film Market Summary
BOPP capacitor film, or biaxially oriented polypropylene capacitor film, is a polypropylene film that has been processed by biaxial oriented process. This film has excellent electrical, mechanical and thermal properties and is widely used in capacitor manufacturing. As a dielectric material of capacitors, BOPP capacitor film can effectively store charge and play the role of filtering, coupling, decoupling, bypassing, etc. in circuits.
The upstream of the BOPP capacitor film industry chain mainly consists of suppliers of raw materials such as polypropylene and production equipment; the midstream consists of film manufacturing companies; and the downstream is widely used in the manufacture of film capacitors for new energy vehicles, photovoltaics, and home appliances.
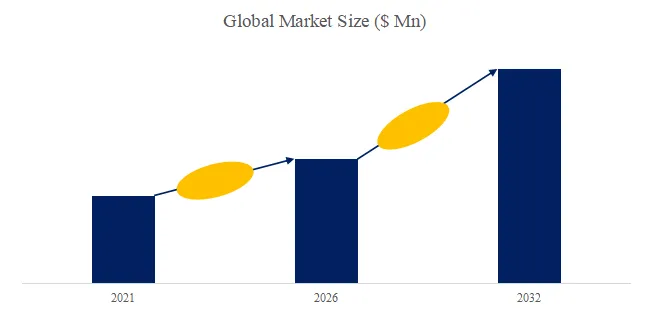
According to the new market research report “Global BOPP Capacitor Film Market Report 2026-2032”, published by QYResearch, the global BOPP Capacitor Film market size is projected to reach USD 1.62 billion by 2032, at a CAGR of 6.7% during the forecast period.
Figure00002. Global BOPP Capacitor Film Market Size (US$ Million), 2021-2032
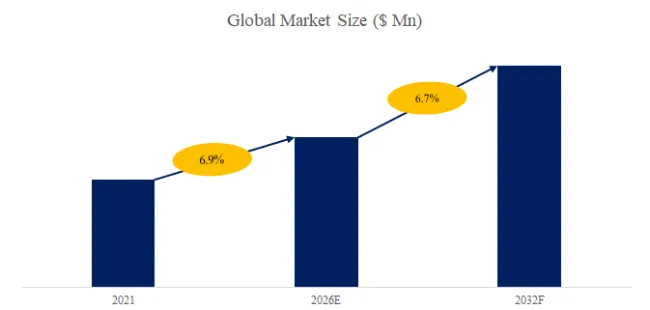
Above data is based on report from QYResearch: Global BOPP Capacitor Film Market Report 2026-2032 (published in 2026). If you need the latest data, plaese contact QYResearch.
As a core dielectric material for film capacitors, BOPP capacitor film holds an irreplaceable position in new energy, power electronics, and rail transportation due to its high dielectric strength, self-healing properties, and long lifespan. Its industrial chain presents a collaborative system of “upstream petrochemical raw materials—midstream precision manufacturing—downstream high-end applications”: upstream, polypropylene resin is the mainstay, with companies like CNPC and Sinopec providing basic raw materials, supplemented by additives such as antioxidants and slip agents to optimize performance; midstream production relies on internationally advanced biaxial stretching equipment from companies like Bruckner (Germany) and Masson (France), while domestic companies like Tongfeng Electronics and Dasouth have achieved large-scale production of ultra-thin and high-temperature resistant products through technological iteration; downstream, it is deeply integrated with strategic emerging industries such as new energy vehicles, photovoltaic inverters, and 5G communications, forming a virtuous cycle driven by demand.
Industry policies continue to empower high-end and green transformation. The National Development and Reform Commission’s “Guidance Catalogue for Industrial Structure Adjustment” lists functional polyester film as an encouraged category, promoting import substitution; the Ministry of Industry and Information Technology’s “dual-carbon” strategy requires companies to adopt environmentally friendly raw materials and intelligent processes to reduce energy consumption and improve the recycling rate of waste film. Local supporting policies, through tax incentives and R&D subsidies, accelerate the integration of industry, academia, and research. For example, the Yangtze River Delta region has cultivated a globally competitive BOPP capacitor film industry cluster.
Development opportunities and challenges coexist
With the implementation of high-voltage platforms for new energy vehicles, wind power converters, and flexible DC transmission projects, the demand for ultra-thin (≤3μm), high dielectric constant products is surging, and the global market size is expected to exceed 15 billion yuan by 2030. However, significant technological barriers exist: the localization rate of high-end equipment is less than 20%, and the production line ordering cycle is as long as 3 years; functional masterbatch formulation patents are mostly monopolized by overseas entities, and the R&D cycle for synchronous stretching processes is as long as 5-8 years. Stricter environmental policies are forcing companies to adopt bio-based polypropylene and closed-loop recycling systems; some leading companies have already achieved a 30% reduction in production energy consumption and a 40% reduction in carbon emissions.
The barriers to entry in the BOPP capacitor film industry exhibit multi-dimensional characteristics
In terms of capital, a single imported production line requires an investment exceeding 150 million yuan, and with the added cost of cleanroom construction, the initial investment reaches 300-500 million yuan. Technological barriers involve interdisciplinary fields such as polymer physics and electrical engineering, requiring long-term accumulation to master core processes such as the biaxial two-step stretching flat film method. Brand and customer barriers require establishing a globally comprehensive certification system and stable supply relationships, making it difficult for new entrants to achieve effective market penetration within 3-5 years.
Looking to the future, the BOPP capacitor film industry will evolve along a path of “high-end, intelligent, and green.” Enterprises need to increase R&D efforts in ultra-thin and high-temperature resistant products, breaking through the bottleneck of equipment localization; achieving real-time monitoring of production data and process optimization through the Industrial Internet; and building a green management system covering the entire lifecycle from raw materials to recycling. Driven by both policy guidance and market demand, BOPP capacitor film is expected to become a key basic material supporting the new energy revolution, leading the electronics and power industry towards a more efficient and sustainable future.
The report provides a detailed analysis of the market size, growth potential, and key trends for each segment. Through detailed analysis, industry players can identify profit opportunities, develop strategies for specific customer segments, and allocate resources effectively.
The BOPP Capacitor Film market is segmented as below:
By Company
Toray Industries, Inc.
Quanzhou Jiadeli Electronic
Hubei Longchen Technical
Zhejiang Great Southeast Co.,limited
Anhui Tongfeng Electronic Company Limited
Hebei Haiwei Group
Treofan (B.C.Jindal Group)
FlexFilm
Nantong Bison Electronic New Material
Bolloré Group
FSPG HI-TECH CO., LTD.
Tervakoski Film
Steiner GmbH & CO. KG
Xpro India Limited
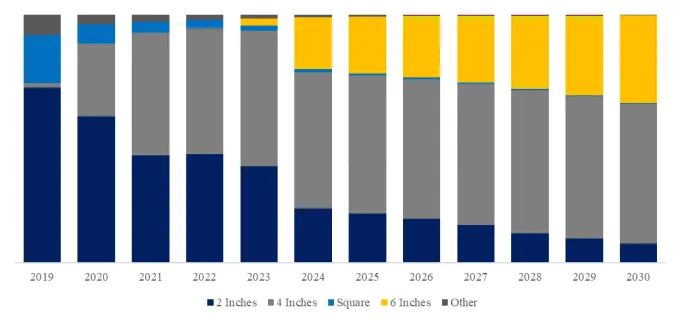
Segment by Type
Below 3 μm
4~6 μm
6~9 μm
9~12 μm
Above 12 μm
Segment by Application
Automotive
Household Appliances
Wind & Solar Power
Industrial Control & Rail Transportation
Others
Each chapter of the report provides detailed information for readers to further understand the BOPP Capacitor Film market:
Chapter 1: Introduces the report scope of the BOPP Capacitor Film report, global total market size (valve, volume and price). This chapter also provides the market dynamics, latest developments of the market, the driving factors and restrictive factors of the market, the challenges and risks faced by manufacturers in the industry, and the analysis of relevant policies in the industry. (2021-2032)
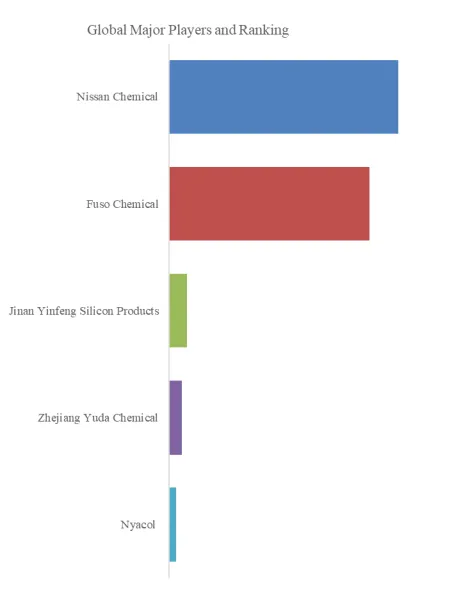
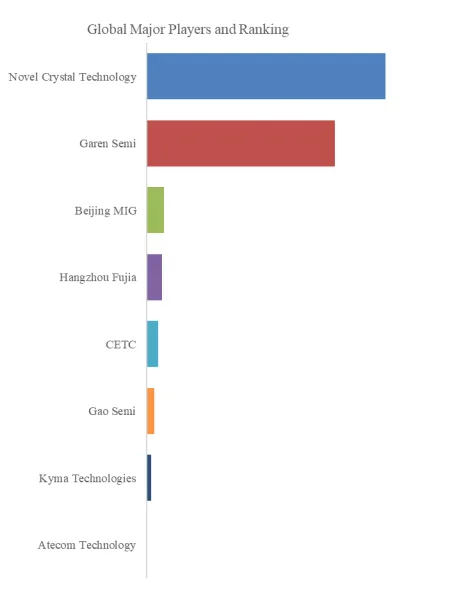
Chapter 2: Detailed analysis of BOPP Capacitor Film manufacturers competitive landscape, price, sales and revenue market share, latest development plan, merger, and acquisition information, etc. (2021-2026)
Chapter 3: Provides the analysis of various BOPP Capacitor Film market segments by Type, covering the market size and development potential of each market segment, to help readers find the blue ocean market in different market segments. (2021-2032)
Chapter 4: Provides the analysis of various market segments by Application, covering the market size and development potential of each market segment, to help readers find the blue ocean market in different downstream markets.(2021-2032)
Chapter 5: Sales, revenue of BOPP Capacitor Film in regional level. It provides a quantitative analysis of the market size and development potential of each region and introduces the market development, future development prospects, market space, and market size of each country in the world..(2021-2032)
Chapter 6: Sales, revenue of BOPP Capacitor Film in country level. It provides sigmate data by Type, and by Application for each country/region.(2021-2032)
Chapter 7: Provides profiles of key players, introducing the basic situation of the main companies in the market in detail, including product sales, revenue, price, gross margin, product introduction, recent development, etc. (2021-2026)
Chapter 8: Analysis of industrial chain, including the upstream and downstream of the industry.
Chapter 9: Conclusion.
Benefits of purchasing QYResearch report:
Competitive Analysis: QYResearch provides in-depth BOPP Capacitor Film competitive analysis, including information on key company profiles, new entrants, acquisitions, mergers, large market shear, opportunities, and challenges. These analyses provide clients with a comprehensive understanding of market conditions and competitive dynamics, enabling them to develop effective market strategies and maintain their competitive edge.
Industry Analysis: QYResearch provides BOPP Capacitor Film comprehensive industry data and trend analysis, including raw material analysis, market application analysis, product type analysis, market demand analysis, market supply analysis, downstream market analysis, and supply chain analysis.
and trend analysis. These analyses help clients understand the direction of industry development and make informed business decisions.
Market Size: QYResearch provides BOPP Capacitor Film market size analysis, including capacity, production, sales, production value, price, cost, and profit analysis. This data helps clients understand market size and development potential, and is an important reference for business development.
Other relevant reports of QYResearch:
Global BOPP Capacitor Film Market Insights – Industry Share, Sales Projections, and Demand Outlook 2026-2032
Global BOPP Capacitor Film Market Outlook, In‑Depth Analysis & Forecast to 2032
Global BOPP Capacitor Film Sales Market Report, Competitive Analysis and Regional Opportunities 2026-2032
Global BOPP Capacitor Film Market Research Report 2026
About Us:
QYResearch founded in California, USA in 2007, which is a leading global market research and consulting company. Our primary business include market research reports, custom reports, commissioned research, IPO consultancy, business plans, etc. With over 19 years of experience and a dedicated research team, we are well placed to provide useful information and data for your business, and we have established offices in 7 countries (include United States, Germany, Switzerland, Japan, Korea, China and India) and business partners in over 30 countries. We have provided industrial information services to more than 60,000 companies in over the world.
Contact Us:
If you have any queries regarding this report or if you would like further information, please contact us:
QY Research Inc.
Add: 17890 Castleton Street Suite 369 City of Industry CA 91748 United States
EN: https://www.qyresearch.com
Email: global@qyresearch.com
Tel: 001-626-842-1666(US)
JP: https://www.qyresearch.co.jp