QY Research Inc. (Global Market Report Research Publisher) announces the release of 2025 latest report “Medical Pressure Mapping System- Global Market Share and Ranking, Overall Sales and Demand Forecast 2026-2032”. Based on current situation and impact historical analysis (2020-2024) and forecast calculations (2026-2032), this report provides a comprehensive analysis of the global Medical Pressure Mapping System market, including market size, share, demand, industry development status, and forecasts for the next few years.
The global market for Medical Pressure Mapping System was estimated to be worth US$ 285 million in 2025 and is projected to reach US$ 456 million, growing at a CAGR of 6.7% from 2026 to 2032.
【Get a free sample PDF of this report (Including Full TOC, List of Tables & Figures, Chart)】
https://www.qyresearch.com/reports/6073958/medical-pressure-mapping-system
Medical Pressure Mapping System Market Summary
Medical Pressure Mapping System is a specialized medical device designed to measure, record, visualize and analyze the pressure distribution between the human body and contact surfaces (such as hospital beds, wheelchairs, prosthetics, and orthopedic braces). It is composed of a flexible pressure sensor array, data acquisition module, and professional analysis software, which can convert the pressure signals generated by body contact into intuitive 2D or 3D pressure maps, displaying real-time pressure values, distribution ranges, and duration. Unlike ordinary pressure measurement tools, it features high precision, high sensitivity, and non-invasiveness, and is widely used in clinical practice to assist in the prevention and management of pressure ulcers, assess the fit of orthopedic and prosthetic devices, guide rehabilitation training, and optimize the design of medical equipment. Its core value lies in providing objective, quantitative pressure data for medical staff, helping to formulate personalized care and treatment plans, reduce the risk of pressure-related complications, and improve the quality of medical care and patient comfort.
The current market for Medical Pressure Mapping Systems is growing steadily, driven by the rising prevalence of pressure ulcers, the aging global population, and increasing demand for precision patient care in clinical and rehabilitative settings, with products integrating core functions such as real-time pressure visualization, data analytics, and compatibility with electronic medical records, supported by advancements in sensor technology and AI algorithms, and a competitive landscape featuring specialized medical device firms focusing on clinical applicability.
According to the new market research report “Global Medical Pressure Mapping System Market Report 2026-2032″, published by QYResearch, the global market for Medical Pressure Mapping System was valued at US$ 285 million in the year 2025 and is projected to reach a revised size of US$ 456 million by 2032, growing at a CAGR of 6.7% during the forecast period 2026-2032.
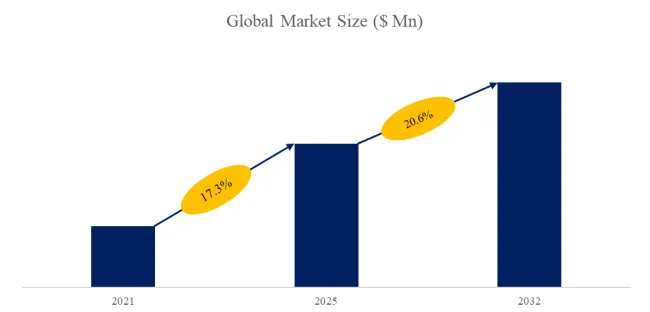
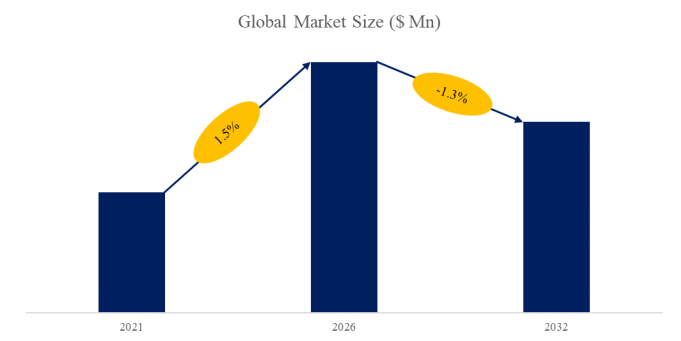
Figure00002. Global Medical Pressure Mapping System Market Size (US$ Million), 2026 VS 2032
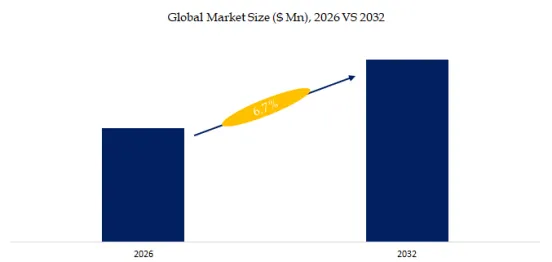
Above data is based on report from QYResearch: Global Medical Pressure Mapping SystemMarket Report 2026-2032(published in 2026). If you need the latest data, plaese contact QYResearch.
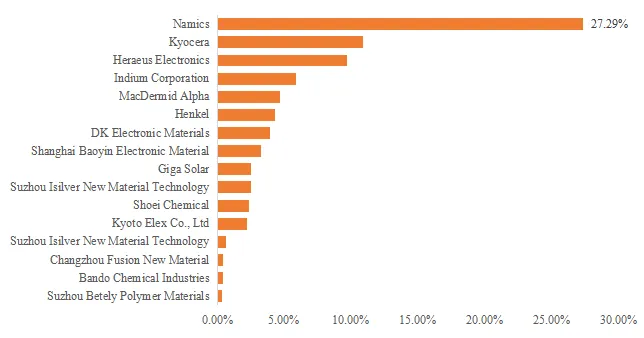
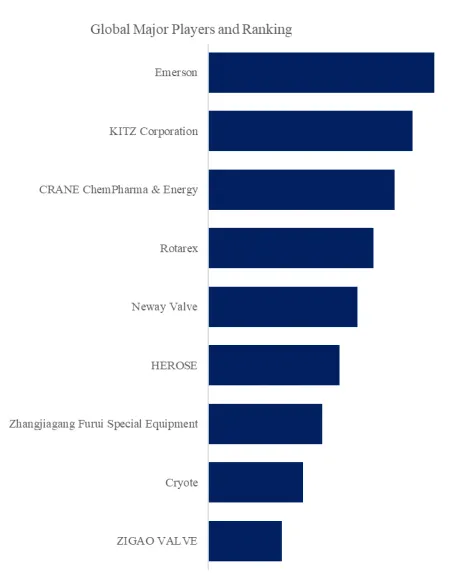
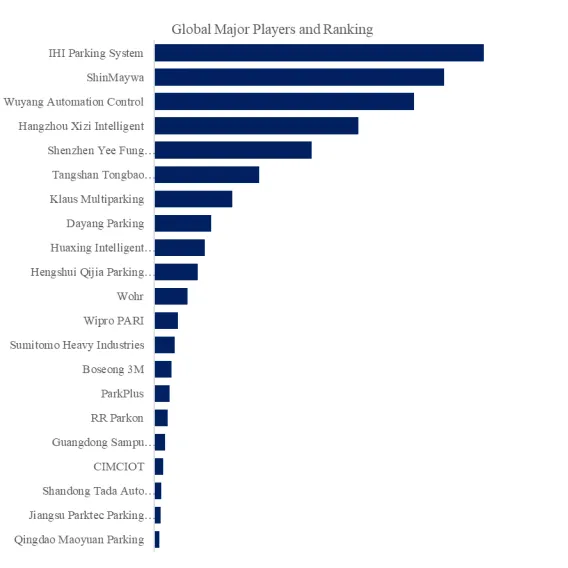
Figure00003. Global Medical Pressure Mapping System Top 11 Players Ranking and Market Share (Ranking is based on the revenue of 2025, continually updated)
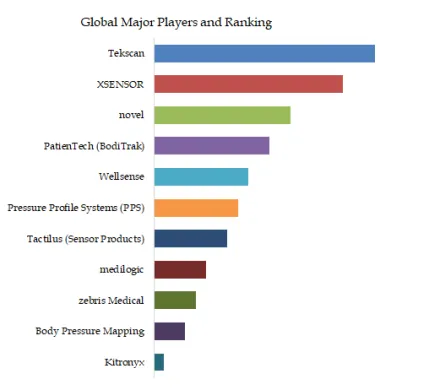
Above data is based on report from QYResearch: Global Medical Pressure Mapping SystemMarket Report 2026-2032 (published in 2026). If you need the latest data, plaese contact QYResearch.
Table 1. Medical Pressure Mapping System Industry Development Trends
| Development Trends | Description | |
| 1 | Intelligent data empowerment | Integration of artificial intelligence algorithms enables real-time pressure trend prediction, early risk stratification, and automatic generation of clinical reports, transforming pressure data from simple visualization into actionable clinical decision support. |
| 2 | Multi-scenario coverage extension | Development is moving beyond traditional ICU and ward applications to home healthcare, rehabilitation centers, and elderly care facilities, catering to the growing demand for continuous monitoring in post-discharge and long-term care settings. |
| 3 | System interoperability integration | Increasing emphasis on compatibility with electronic health records (EHRs), hospital information systems (HIS), and remote monitoring platforms, facilitating seamless data sharing and multidisciplinary collaboration in healthcare ecosystems. |
Source: Secondary Sources, Press Releases, Expert Interviews and QYResearch, 2026
Table 2. Medical Pressure Mapping System Industry Development Opportunities
| Development Opportunities | Description | |
| 1 | Aging population-driven demand | Growth in the elderly population and prevalence of chronic diseases create sustained demand pressure for pressure injury prevention and management solutions, particularly in long-term care institutions. |
| 2 | Preventive healthcare emphasis | Shift from reactive treatment to proactive prevention accelerates adoption of pressure mapping systems in routine patient assessments, driving market penetration across primary care and outpatient settings. |
| 3 | Flexible sensor technology innovation | Breakthroughs in flexible, thin-film, and wearable sensor technologies enable more comfortable, non-invasive monitoring solutions, expanding application scenarios and improving user acceptance. |
Source: Secondary Sources, Press Releases, Expert Interviews and QYResearch, 2026
Table 3. Medical Pressure Mapping System Obstacles/Challenges to Industry Development
| Obstacles/Challenges | Description | |
| 1 | High cost barriers | Complex manufacturing processes and precision component requirements result in high equipment costs, creating affordability challenges for small and medium-sized healthcare facilities, especially in emerging markets. |
| 2 | Stringent regulatory compliance | As medical devices, products must undergo rigorous certification and approval processes, varying by region, which increases R&D and market entry costs and prolongs time-to-market. |
| 3 | Data standardization gaps | Lack of unified data formats and measurement standards across different systems hinders data interoperability and clinical evidence accumulation, limiting the effectiveness of large-scale data analysis and research. |
Source: Secondary Sources, Press Releases, Expert Interviews and QYResearch, 2026
Future trends will focus on enhanced AI-driven predictive capabilities for pressure injury prevention, improved wireless connectivity and cloud-based data management, miniaturization and portability for home healthcare use, deeper integration with existing healthcare IT systems, and cost optimization to expand adoption among small healthcare facilities, while advancing flexible sensing technology for broader clinical applications.
The report provides a detailed analysis of the market size, growth potential, and key trends for each segment. Through detailed analysis, industry players can identify profit opportunities, develop strategies for specific customer segments, and allocate resources effectively.
The Medical Pressure Mapping System market is segmented as below:
By Company
Tactilus(Sensor Products)
PatienTech(BodiTrak)
Tekscan
Kitronyx
Wellsense
Pressure Profile Systems (PPS)
XSENSOR
Body Pressure Mapping
novel
medilogic
zebris Medical
Segment by Type
Seating Pressure Mapping
Mattress and Bed Pressure Mapping
Foot Pressure Mapping
Others
Segment by Application
Prevention of Pressure Ulcers
Wound Care
Ergonomic Adjustments
Diabetic Foot Care
Surgical Applications
Others
Each chapter of the report provides detailed information for readers to further understand the Medical Pressure Mapping System market:
Chapter 1: Introduces the report scope of the Medical Pressure Mapping System report, global total market size (valve, volume and price). This chapter also provides the market dynamics, latest developments of the market, the driving factors and restrictive factors of the market, the challenges and risks faced by manufacturers in the industry, and the analysis of relevant policies in the industry. (2021-2032)
Chapter 2: Detailed analysis of Medical Pressure Mapping System manufacturers competitive landscape, price, sales and revenue market share, latest development plan, merger, and acquisition information, etc. (2021-2026)
Chapter 3: Provides the analysis of various Medical Pressure Mapping System market segments by Type, covering the market size and development potential of each market segment, to help readers find the blue ocean market in different market segments. (2021-2032)
Chapter 4: Provides the analysis of various market segments by Application, covering the market size and development potential of each market segment, to help readers find the blue ocean market in different downstream markets.(2021-2032)
Chapter 5: Sales, revenue of Medical Pressure Mapping System in regional level. It provides a quantitative analysis of the market size and development potential of each region and introduces the market development, future development prospects, market space, and market size of each country in the world..(2021-2032)
Chapter 6: Sales, revenue of Medical Pressure Mapping System in country level. It provides sigmate data by Type, and by Application for each country/region.(2021-2032)
Chapter 7: Provides profiles of key players, introducing the basic situation of the main companies in the market in detail, including product sales, revenue, price, gross margin, product introduction, recent development, etc. (2021-2026)
Chapter 8: Analysis of industrial chain, including the upstream and downstream of the industry.
Chapter 9: Conclusion.
Benefits of purchasing QYResearch report:
Competitive Analysis: QYResearch provides in-depth Medical Pressure Mapping System competitive analysis, including information on key company profiles, new entrants, acquisitions, mergers, large market shear, opportunities, and challenges. These analyses provide clients with a comprehensive understanding of market conditions and competitive dynamics, enabling them to develop effective market strategies and maintain their competitive edge.
Industry Analysis: QYResearch provides Medical Pressure Mapping System comprehensive industry data and trend analysis, including raw material analysis, market application analysis, product type analysis, market demand analysis, market supply analysis, downstream market analysis, and supply chain analysis.
and trend analysis. These analyses help clients understand the direction of industry development and make informed business decisions.
Market Size: QYResearch provides Medical Pressure Mapping System market size analysis, including capacity, production, sales, production value, price, cost, and profit analysis. This data helps clients understand market size and development potential, and is an important reference for business development.
Other relevant reports of QYResearch:
Global Medical Pressure Mapping System Market Outlook, In‑Depth Analysis & Forecast to 2032
Global Medical Pressure Mapping System Market Research Report 2026
Global Medical Pressure Mapping System Sales Market Report, Competitive Analysis and Regional Opportunities 2026-2032
About Us:
QYResearch founded in California, USA in 2007, which is a leading global market research and consulting company. Our primary business include market research reports, custom reports, commissioned research, IPO consultancy, business plans, etc. With over 19 years of experience and a dedicated research team, we are well placed to provide useful information and data for your business, and we have established offices in 7 countries (include United States, Germany, Switzerland, Japan, Korea, China and India) and business partners in over 30 countries. We have provided industrial information services to more than 60,000 companies in over the world.
Contact Us:
If you have any queries regarding this report or if you would like further information, please contact us:
QY Research Inc.
Add: 17890 Castleton Street Suite 369 City of Industry CA 91748 United States
EN: https://www.qyresearch.com
Email: global@qyresearch.com
Tel: 001-626-842-1666(US)
JP: https://www.qyresearch.co.jp