Medical Wire Harness Research:CAGR of 8.6% over the next few years

Medical Wiring Harness Market Summary

Medical wiring harnesses are cable assembly systems used for connections within and between medical devices. They primarily perform power transmission, signal transmission, and data communication functions, and are key basic components for ensuring the stable operation and safety of medical devices. They are widely used in fields such as imaging equipment, monitoring equipment, surgical instruments, in vitro diagnostic equipment, and life support systems.


According to the latest report “Global Medical Wire Harness Market Report 2025-2031″ by QYResearch, the global medical wire harness market is expected to reach US$11.53 billion in 2031, with a CAGR of 8.6% over the next few years.

Figure00001. Global Medical Wiring Harness Market Size (US$ Million), 2025-2031

Medical Wire Harness

Above data is based on report from QYResearch: Global Medical Wiring Harness Market Report 2025-2031 (published in 2026). If you need the latest data, plaese contact QYResearch.

Figure00002. Global Medical Wiring Harness Top 16 Players Ranking and Market Share (Ranking is based on the revenue of 2025, continually updated)

Medical Wire Harness

Above data is based on report from QYResearch: Global Medical Wiring Harness Market Report 2025-2031 (published in 2026). If you need the latest data, plaese contact QYResearch.

According to a survey by QYResearch’s Leading Enterprise Research Center, major global manufacturers of medical wiring harnesses include Amphenol Alden, TE Connectivity, Bizlink, Hirose Electric, Epic Engineered Technologies, HUBER+SUHNER, ZheJiang Tony Electronic, Luxshare ICT, China Aviation Optical-Electrical Technology, and Kingsignal Technology.

In 2025, the top ten global manufacturers held approximately 68.0% of the market share.

Figure00003. Medical Wiring Harness, Global Market Size, Split by Product Segment

Medical Wire Harness

Based on or includes research from QYResearch: Global Medical Wiring Harness Market Report 2025-2031.

In terms of product type, nursing care medical harnesses are currently the most important product segment, accounting for approximately 52.6% of the market share (2025).

Figure00004. Medical Wiring Harness, Global Market Size, Split by Application Segment

Medical Wire Harness

Based on or includes research from QYResearch: Global Medical Wiring Harness Market Report 2025-2031.

In terms of product application, hospitals are currently the most important product segment, accounting for approximately 66.6% of the market share (2025).

Figure00005. Medical Wiring Harness, Global Market Size, Split by Region

Medical Wire Harness

Based on or includes research from QYResearch: Global Medical Wiring Harness Market Report 2025-2031.


About The Authors


Analyst: Ran xinrong

Email: ranxinrong@qyresearch.com

Website: www.qyresearch.com Hot Line:4006068865

QYResearch focus on Market Survey and Research

US: +1-888-365-4458(US) +1-202-499-1434(Int’L)

EU: +44-808-111-0143(UK) +44-203-734-8135(EU)

Asia: +86-10-8294-5717(CN) +852-30628839(HK)


The main analyst of this report: Ran

Email: ranxinrong@qyresearch.com

Has 3 years of industry research experience, focusing on research in the fields of communications and related industry chains, including 5G, 5G-A related, switches, CPO, routers and CPE, Metaverse and its communication networks, optical fiber cables and other topics and extended research.

About QYResearch

QYResearch founded in California, USA in 2007.It is a leading global market research and consulting company. With over 17 years’ experience and professional research team in various cities over the world QY Research focuses on management consulting, database and seminar services, IPO consulting (data is widely cited in prospectuses, annual reports and presentations), industry chain research and customized research to help our clients in providing non-linear revenue model and make them successful. We are globally recognized for our expansive portfolio of services, good corporate citizenship, and our strong commitment to sustainability. Up to now, we have cooperated with more than 60,000 clients across five continents. Let’s work closely with you and build a bold and better future.

QYResearch is a world-renowned large-scale consulting company. The industry covers various high-tech industry chain market segments, spanning the semiconductor industry chain (semiconductor equipment and parts, semiconductor materials, ICs, Foundry, packaging and testing, discrete devices, sensors, optoelectronic devices), photovoltaic industry chain (equipment, cells, modules, auxiliary material brackets, inverters, power station terminals), new energy automobile industry chain (batteries and materials, auto parts, batteries, motors, electronic control, automotive semiconductors, etc.), communication industry chain (communication system equipment, terminal equipment, electronic components, RF front-end, optical modules, 4G/5G/6G, broadband, IoT, digital economy, AI), advanced materials industry Chain (metal materials, polymer materials, ceramic materials, nano materials, etc.), machinery manufacturing industry chain (CNC machine tools, construction machinery, electrical machinery, 3C automation, industrial robots, lasers, industrial control, drones), food, beverages and pharmaceuticals, medical equipment, agriculture, etc.

About Us:
QYResearch founded in California, USA in 2007, which is a leading global market research and consulting company. Our primary business include market research reports, custom reports, commissioned research, IPO consultancy, business plans, etc. With over 18 years of experience and a dedicated research team, we are well placed to provide useful information and data for your business, and we have established offices in 7 countries (include United States, Germany, Switzerland, Japan, Korea, China and India) and business partners in over 30 countries. We have provided industrial information services to more than 60,000 companies in over the world.

Contact Us:
If you have any queries regarding this report or if you would like further information, please contact us:
QY Research Inc.
Add: 17890 Castleton Street Suite 369 City of Industry CA 91748 United States
EN: https://www.qyresearch.com
Email: global@qyresearch.com
Tel: 001-626-842-1666(US)
JP: https://www.qyresearch.co.jp

カテゴリー: 未分類 | 投稿者huangsisi 12:08 | コメントをどうぞ

Man-made Leather Research:CAGR of about 7.1% during 2026-2032

Man-made Leather Market Summary

Man-made leather is a leather-like material formed by combining polyurethane, PVC, and other polymer-based surface systems with woven fabrics, knitted fabrics, nonwovens, or microfiber substrates through coating, lamination, foaming, embossing, and finishing processes. Its value lies not only in replicating the texture, appearance, and tactile qualities of genuine leather, but also in delivering thickness consistency, color stability, strong processing adaptability, scalable continuous production, and the ability to optimize performance in areas such as abrasion resistance, weatherability, low-VOC behavior, cleanability, softness, and lightweight construction. After years of technological development, the industry has expanded into multiple product routes, including PVC, conventional PU, microfiber PU, and ecological functional PU, with broad applications across apparel accessories, furnishing, automotive interiors, sports goods, and a wide range of consumer and industrial surface applications. At this stage of industrial upgrading, man-made leather is no longer merely an alternative to genuine leather. It has become an important advanced materials category positioned at the intersection of green manufacturing, product design, functional performance, and brand value expression.

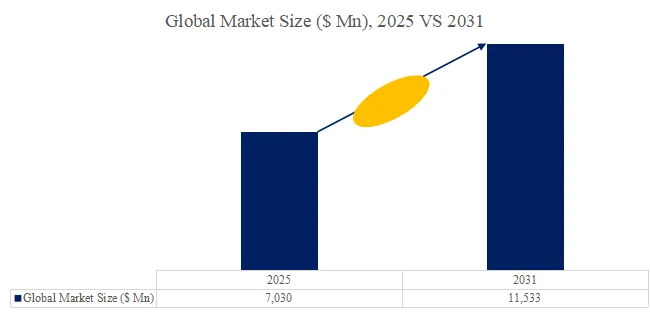
According to QYResearch’s latest report, Global Man-made Leather Market Report 2026-2032, the global and China man-made leather industries have entered a more visible and resilient expansion cycle. Using 2025 as the reference point, the global market is estimated at about USD 23.08 billion and is expected to rise to approximately USD 37.79 billion by 2032, representing a CAGR of about 7.1% during 2026-2032. Over the same period, the China market is estimated at about USD 6.66 billion and is projected to increase to roughly USD 11.54 billion by 2032, with a CAGR of about 8.17%. These figures indicate more than a simple recovery in demand. They reflect a simultaneous upgrade in product structure, application hierarchy, and value creation. The global market continues to expand steadily, while China remains a key arena for manufacturing capability, demand upgrading, and product iteration. For executives, commercial decision-makers, and investors, man-made leather is no longer a conventional materials segment driven mainly by cost advantages. It is increasingly a value-oriented industry supported by technological advancement, consumer upgrading, and manufacturing renewal.

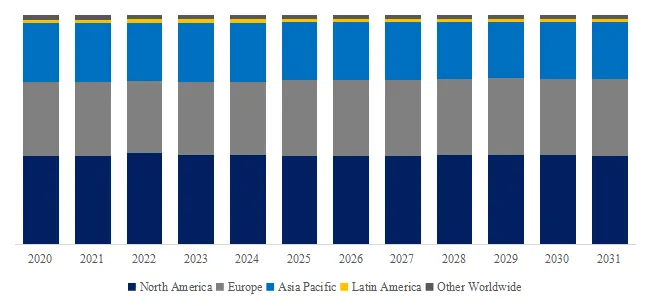
Figure00001. Global Man-made Leather Market Size (US$ Million), 2021-2032

Man-made Leather

Above data is based on report from QYResearch: Global Man-made Leather Market Report 2025-2031 (published in 2025). If you need the latest data, plaese contact QYResearch.

Premium Applications Are Redefining the Industry’s Value Ceiling

One of the most important shifts in the market is that downstream demand is moving rapidly toward more demanding application scenarios. Apparel accessories remain the largest foundational demand segment worldwide, but the real expansion in industry upside is increasingly coming from automotive interiors, quality-oriented furnishing, athleisure consumption, and consumer applications that place greater emphasis on touch, comfort, and environmental credentials. As new-energy vehicles, integrated home furnishing solutions, premium sports-inspired lifestyles, and brand-focused design strategies continue to develop, customer expectations for materials have shifted from simple replacement to clear upgrading. Abrasion resistance, hydrolysis resistance, low odor, low emissions, lightweight construction, color consistency, easy maintenance, and reliable large-scale delivery are becoming central requirements for entry into high-quality customer systems. For that reason, future competition in man-made leather will no longer revolve mainly around price and appearance. It will increasingly be defined by a comprehensive mix of functional performance, green attributes, and application-specific suitability.

China’s Role Has Moved Far Beyond That of a Single Regional Market

China continues to strengthen its strategic role within the global industry map. Its importance is defined not only by scale, but also by its ability to shape the direction of industry upgrading. China combines relatively complete capabilities in resin systems, substrate supply, lamination and coating, surface finishing, and large-scale manufacturing, while also maintaining close coordination with downstream clusters in footwear, bags, furnishing, automotive components, and consumer product manufacturing. This ecosystem advantage allows China to respond more quickly to international customer requirements for new materials, new processes, and highly consistent delivery standards. It also gives domestic producers stronger resilience in new product introduction, process improvement, and commercial ramp-up. Over the coming years, China is expected to remain one of the world’s most important supply centers for man-made leather, while also serving as the most representative market for observing structural upgrading, downstream application shifts, and changes in customer preferences. The global market will continue to be defined by expansion, while China will continue to be defined by upgrading.

Green Processing and Material Upgrading Are Reshaping Competitive Thresholds

Toward 2032, competitive positioning will be determined far less by installed capacity alone and far more by green manufacturing capability and material upgrading capacity. As brand owners, automotive supply chains, and consumer goods markets continue to tighten their requirements around environmental compliance, traceability, low emissions, and sustainable materials, man-made leather producers are facing not only cost pressure, but also a deeper need to redesign both process systems and product portfolios. Conventional grades will remain an important part of the commercial base, but microfiber, ecological, and functional materials are becoming the more dynamic growth directions. The companies that gain stronger market recognition will not simply be those with larger installed capacity, but those able to build an integrated capability set across resin systems, substrate engineering, surface treatment, green processing, quality control, and collaborative customer development. This means that the industry’s future value creation will be driven increasingly by technical depth, customer quality, and product mix improvement rather than by low-cost substitution alone.

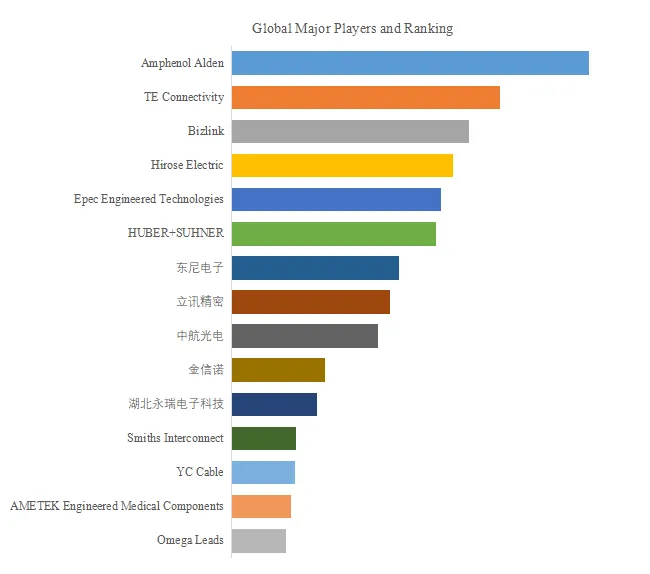
In a Fragmented Market, the Real Winners Will Emerge from High-Value Niches

The global man-made leather market still maintains a relatively low level of concentration. Leading manufacturers are strengthening their positions, but the market has not entered a highly monopolized stage. On a cautious 2025 basis, the combined market share of the global top five players is estimated at around 10%, indicating that the overall market remains broad and that many niche segments still offer room for continued restructuring. This is not a weakness. On the contrary, it suggests that premium niches remain highly capable of producing structural winners. The most competitive companies in the coming years are unlikely to be those trying to dominate every product line at once. They are more likely to be those establishing distinctive strengths in areas such as automotive-grade interior materials, microfiber synthetic leather, ecological functional PU, premium furnishing surfaces, or performance-oriented materials for sports-related consumer products. For corporate decision-makers, this is a competition shaped by product routes, customer quality, and long-term technical investment. For investors, it remains an industry with meaningful potential for the emergence of niche leaders and valuation re-rating opportunities.

Toward 2032, the Industry’s Appeal Will Be Defined by an Upgrading Logic Rather than a Substitution Logic

QYResearch’s latest market analysis makes one point especially clear: from a 2026 publication perspective, the defining feature of the global and China man-made leather markets is no longer simple substitution, but accelerated upgrading. The industry still retains its original role as an alternative to genuine leather, yet the real drivers of future growth are now green manufacturing, functional innovation, deeper penetration into premium applications, and stronger industry-chain coordination. The central question in the past was whether substitution could happen. The central question today is whether upgrading can be delivered. In the past, attention focused on supply scale. Today, attention is shifting toward product mix, customer tier, and long-term sustainability capability. Looking toward 2032, man-made leather is no longer simply a traditional materials industry. It is becoming a value-driven arena shaped simultaneously by new consumption patterns, new vehicles, new furnishing demands, and new manufacturing priorities. The companies that move earlier in green process transformation, enter premium application chains faster, and convert material capability into clearly perceived customer value will be best positioned to lead the next stage of reshaping in both the global and China markets.


About The Authors

Ms Zhao. Senior Analyst

Beijing Hengzhou Bozhi International Information Consulting Co.,Ltd. (QYResearch CO.,LIMITED)

Room C1501,U-Center Building,No.28 Chengfu Road, Haidian District,Beijing,100083,China

Tel:+86-15600075800 (9.00am-6.00pm UTC+8), zhaopeihong@qyresearch.com

Website: www.qyresearch.com Hot Line:4006068865

Tel:+1-6262952442(US) +81-9038009273(JP) +44-8081110143(UK)

+86-1082945717(CN) +82-1075511278(KR) +91-9766478224(IN)


About QYResearch

QYResearch founded in California, USA in 2007.It is a leading global market research and consulting company. With over 17 years’ experience and professional research team in various cities over the world QY Research focuses on management consulting, database and seminar services, IPO consulting (data is widely cited in prospectuses, annual reports and presentations), industry chain research and customized research to help our clients in providing non-linear revenue model and make them successful. We are globally recognized for our expansive portfolio of services, good corporate citizenship, and our strong commitment to sustainability. Up to now, we have cooperated with more than 60,000 clients across five continents. Let’s work closely with you and build a bold and better future.

QYResearch is a world-renowned large-scale consulting company. The industry covers various high-tech industry chain market segments, spanning the semiconductor industry chain (semiconductor equipment and parts, semiconductor materials, ICs, Foundry, packaging and testing, discrete devices, sensors, optoelectronic devices), photovoltaic industry chain (equipment, cells, modules, auxiliary material brackets, inverters, power station terminals), new energy automobile industry chain (batteries and materials, auto parts, batteries, motors, electronic control, automotive semiconductors, etc.), communication industry chain (communication system equipment, terminal equipment, electronic components, RF front-end, optical modules, 4G/5G/6G, broadband, IoT, digital economy, AI), advanced materials industry Chain (metal materials, polymer materials, ceramic materials, nano materials, etc.), machinery manufacturing industry chain (CNC machine tools, construction machinery, electrical machinery, 3C automation, industrial robots, lasers, industrial control, drones), food, beverages and pharmaceuticals, medical equipment, agriculture, etc.

About Us:
QYResearch founded in California, USA in 2007, which is a leading global market research and consulting company. Our primary business include market research reports, custom reports, commissioned research, IPO consultancy, business plans, etc. With over 18 years of experience and a dedicated research team, we are well placed to provide useful information and data for your business, and we have established offices in 7 countries (include United States, Germany, Switzerland, Japan, Korea, China and India) and business partners in over 30 countries. We have provided industrial information services to more than 60,000 companies in over the world.

Contact Us:
If you have any queries regarding this report or if you would like further information, please contact us:
QY Research Inc.
Add: 17890 Castleton Street Suite 369 City of Industry CA 91748 United States
EN: https://www.qyresearch.com
Email: global@qyresearch.com
Tel: 001-626-842-1666(US)
JP: https://www.qyresearch.co.jp

カテゴリー: 未分類 | 投稿者huangsisi 12:04 | コメントをどうぞ

High Voltage SVG Market Forecast 2026-2032: Static Var Generation, Grid Voltage Stability, and Growth to US$ 1.16 Billion at 6.0% CAGR

Global Leading Market Research Publisher QYResearch announces the release of its latest report “High Voltage SVG – Global Market Share and Ranking, Overall Sales and Demand Forecast 2026-2032″. Based on current situation and impact historical analysis (2021-2025) and forecast calculations (2026-2032), this report provides a comprehensive analysis of the global High Voltage SVG market, including market size, share, demand, industry development status, and forecasts for the next few years.

For grid operators, renewable energy developers, and industrial facility managers, maintaining voltage stability under fluctuating load and generation conditions is a persistent challenge. Traditional passive compensation (capacitor banks, reactors) responds slowly, steps discretely, and cannot handle dynamic events like wind gusts or large motor starts. The high voltage static var generator (SVG) solves this through reactive power compensation: a power electronic device (voltage-source converter) that continuously and instantaneously injects or absorbs reactive power (VArs) to regulate voltage, improve power factor, and reduce transmission losses. According to QYResearch’s updated model, the global market for High Voltage SVG was estimated to be worth US$ 777 million in 2025 and is projected to reach US$ 1,162 million, growing at a CAGR of 6.0% from 2026 to 2032. In 2024, global High Voltage SVG production reached approximately 13,500 units, with an average global market price of around US$ 54,300 per unit. The High Voltage SVG is a Static Var Generator used in power systems to enhance voltage stability, improve power quality, and reduce line losses by compensating reactive power, widely applied in power grids, renewable energy generation, industry, etc.

【Get a free sample PDF of this report (Including Full TOC, List of Tables & Figures, Chart)】
https://www.qyresearch.com/reports/6097807/high-voltage-svg

1. Technical Architecture: SVG vs. Traditional Compensation

High voltage SVGs (also known as STATCOM — static synchronous compensator) differ fundamentally from traditional reactive power compensation technologies:

Parameter Capacitor Bank SVC (TCR/ TSC) High Voltage SVG (STATCOM)
Response time 2-5 cycles (40-100ms) 2-3 cycles (40-60ms) Sub-cycle (<10ms)
Compensation range Capacitive only Capacitive + inductive (discrete steps) Continuous capacitive to inductive
Harmonics generation None Moderate (TCR) Low (PWM cancels harmonics)
Voltage support capability Degrades as voltage drops Degrades as voltage drops Maintains full rating down to 0.2-0.3 pu voltage
Footprint Large (switched banks) Moderate Compact (containerized)
Losses Very low (<0.5%) 0.5-1.0% 0.8-1.5%

Key technical challenge – high-power IGBT reliability at medium voltage: SVGs use series-connected IGBTs to achieve 6kV-35kV operation directly (without step-up transformer). Over the past six months, several advancements have emerged:

  • Siemens (February 2026) introduced a press-pack IGBT module with 4.5kV/3kA rating and built-in short-circuit failure mode, improving SVG reliability (MTBF increased from 50,000 to 80,000 hours).
  • Hitachi (March 2026) commercialized a modular multilevel converter (MMC) SVG for 35kV applications using 1.7kV IGBTs (vs. 4.5kV series-connected), simplifying redundancy and improving availability to 99.99%.
  • Sieyuan Electric (January 2026) launched a liquid-cooled SVG for harsh environments (desert, offshore) operating at 55°C ambient without derating, addressing a key limitation of air-cooled designs.

Industry insight – discrete vs. system manufacturing: High voltage SVG production is low-volume, engineered-to-order discrete manufacturing (13,500 units globally in 2024 = ~1,100 units per month across all manufacturers). Each unit is customized for voltage (6kV, 10kV, 35kV), power rating (1-100 MVAr), and cooling (air, liquid). Lead times: 16-30 weeks. ASP: US$ 30,000-80,000 for 6-10kV units; US$ 80,000-200,000 for 35kV units.

2. Market Segmentation: Voltage Level and Application

The High Voltage SVG market is segmented as below:

Key Players: Siemens, Hitachi, Mitsubishi Electric, GE, WindSun Science Technology, Sieyuan Electric, Liaoning Rongxin Xingye Power Technology, Shandong Taikai Power Electronic, Shenzhen Hopewind Electric, TBEA Xinjiang Sunoasis, Nanjing Switchgear, Shandong Albertson Electric, Wolong Electric Group, Shandong Huatian Technology Group

Segment by Type (Voltage Level):

  • 6kV SVG – 25% of 2025 revenue. Industrial applications (mining, cement, steel), smaller renewable plants. ASP: US$ 30,000-50,000.
  • 10kV SVG – Largest segment (40% of revenue). Distribution grid applications, industrial parks, wind/solar farms. ASP: US$ 40,000-70,000.
  • 35kV SVG – 25% of revenue. Transmission grid substations, large renewable plants (100MW+), utility applications. ASP: US$ 80,000-150,000.
  • Others (66kV, 110kV via step-up transformer) – 10%.

Segment by Application:

  • Electric Utilities – Largest segment (45% of revenue). Grid voltage regulation, transmission congestion management, dynamic reactive reserve, black start capability. Utilities increasingly specify SVGs over SVCs for faster response and better low-voltage ride-through (LVRT).
  • Renewable Energy – Fastest-growing segment (35% CAGR). Wind farms (LVRT compliance, voltage stabilization during gusts), solar plants (grid code compliance, power factor correction). Many grid codes (e.g., IEEE 1547-2018, China GB/T 19963) mandate SVG-like performance for renewables >10MW.
  • Industry & Manufacturing – 30% of revenue. Arc furnaces (flicker compensation), rolling mills (voltage stabilization), mines (large motor starting), data centers (power quality).
  • Others – Rail traction (voltage stabilization for high-speed rail), offshore platforms, microgrids (5%).

Typical user case – wind farm LVRT compliance: A 150MW wind farm in Texas required low-voltage ride-through (LVRT) capability per ERCOT grid code (must stay online during voltage dips to 0.15 pu for 0.5 seconds). Installed a 35kV, ±25 MVAr SVG at the point of interconnection (POI). Results: voltage dip recovery time reduced from 300ms to 40ms, LVRT compliance achieved, and annual curtailment reduced by 12% (from 8% to 7% of generation). System cost: US$ 1.8 million (SVG + installation). Payback: 2.5 years (avoided curtailment + production tax credits).

Exclusive observation – the “hybrid SVG + capacitor bank” trend: While SVGs provide continuous control, they have higher losses than passive capacitors for steady-state compensation. Optimized solutions combine SVG (for dynamic events, flicker, voltage dips) with mechanically switched capacitor banks (for steady-state power factor correction). This hybrid approach reduces SVG rating by 30-50%, lowering capital cost by 20-35% while maintaining performance. Sieyuan Electric and WindSun both offer hybrid controller packages.

3. Regional Dynamics and Grid Code Drivers

Region Market Share (2025) Key Drivers
Asia-Pacific 50% Largest renewable installation (China, India, Vietnam), industrial growth (steel, cement, mining), grid code enforcement (China GB/T, India CEA)
North America 22% Renewable integration (ERCOT, CAISO, MISO), aging transmission infrastructure, FERC Order 2222 (DER aggregation requires voltage support)
Europe 18% Offshore wind (North Sea), grid code harmonization (ENTSO-E), industrial power quality (Germany, Italy)
RoW 10% Middle East (arc furnaces, desalination), Latin America (renewables), Africa (mining)

Grid code developments (Jan-Jun 2026):

  • China (GB/T 19963.1-2025, effective April 2026) – Requires wind farms >30MW to provide dynamic reactive power capability equivalent to SVG (response time <30ms, continuous range 0.9-1.1 pu voltage). Previously allowed slower SVCs.
  • ERCOT (Texas, March 2026) – Updated LVRT requirements for inverter-based resources (wind, solar, storage) to prevent cascading outages during voltage dips (inspired by 2021 winter storm). SVGs are preferred compliance solution.
  • Germany (TenneT grid code revision, January 2026) – Mandates that all new renewable plants >10MW have “grid-forming” capability (can establish grid voltage and frequency without synchronous generators). SVGs with VSG (virtual synchronous generator) control mode are required.

Exclusive observation – SVG vs. wind turbine/PCS inverter capability: Modern wind turbine converters and solar PCS inverters can provide reactive power (typically ±0.95 power factor). However, during voltage dips, converters prioritize active power (to maintain torque/load) and may reduce reactive capability. SVGs provide dedicated, guaranteed reactive power independent of active power output, making them preferred for grid code compliance, especially at the point of interconnection.

4. Competitive Landscape and Outlook

The high voltage SVG market features two competitive tiers:

Tier Supplier Group Key Players Strengths
1 Global MNCs Siemens, Hitachi, Mitsubishi Electric, GE Technology leadership, grid code expertise, global service networks, premium pricing (+20-30%)
2 Chinese domestic leaders Sieyuan, Rongxin, Taikai, Hopewind, TBEA, WindSun Cost leadership (20-40% lower ASP), fast customization, domestic market dominance (70%+ share in China)
3 Emerging regional Albertson, Wolong, Huatian, Nanjing Switchgear Regional focus, lower-cost offerings

Technology roadmap (2027-2030):

  • SiC-based SVGs: Higher switching frequency (2-5 kHz vs. 500 Hz-1 kHz for IGBT), smaller filters, lower losses (target 0.5%). Hitachi and Mitsubishi Electric have prototypes.
  • Grid-forming SVG with black start: Enabling renewables to restart grid after blackout without synchronous generators. Siemens and GE have field demonstrations.
  • SVG with integrated battery storage: Combined reactive power (from SVG) and active power (from battery) in single converter. Sieyuan Electric pilot (2026).

With 6.0% CAGR and 13,500 units produced in 2024 (projected 20,000+ by 2030), the high voltage SVG market benefits from renewable integration (wind, solar), grid modernization (aging infrastructure replacement), and stricter grid codes (dynamic reactive power requirements). Risks include competition from SVCs (lower upfront cost, despite slower response), supply chain constraints for high-power IGBT modules (infineon, Mitsubishi, Fuji lead times 40-60 weeks), and utility procurement cycles (3-5 years from specification to energization).


Contact Us:
If you have any queries regarding this report or if you would like further information, please contact us:
QY Research Inc.
Add: 17890 Castleton Street Suite 369 City of Industry CA 91748 United States
EN: https://www.qyresearch.com
E-mail: global@qyresearch.com
Tel: 001-626-842-1666(US)
JP: https://www.qyresearch.co.jp


カテゴリー: 未分類 | 投稿者huangsisi 11:52 | コメントをどうぞ

Industrial & Commercial Power Conversion System Market Forecast 2026-2032: Bidirectional Energy Flow, Peak Shaving, and Growth to US$ 2.22 Billion at 15.7% CAGR

Global Leading Market Research Publisher QYResearch announces the release of its latest report “Industrial & Commercial Power Conversion System – Global Market Share and Ranking, Overall Sales and Demand Forecast 2026-2032″. Based on current situation and impact historical analysis (2021-2025) and forecast calculations (2026-2032), this report provides a comprehensive analysis of the global Industrial & Commercial Power Conversion System market, including market size, share, demand, industry development status, and forecasts for the next few years.

For factory operators, data center managers, and commercial building owners, rising electricity costs and grid instability are pressing concerns. Peak demand charges (often 30-50% of electricity bills), time-of-use (TOU) tariffs, and outage risks disrupt operations and erode margins. The industrial and commercial power conversion system (PCS) solves these through bidirectional energy flow management: a power electronic device that converts between DC (batteries) and AC (grid/loads), enabling peak shaving (discharging batteries during high-tariff periods), valley filling (charging during low-tariff periods), and emergency backup power. According to QYResearch’s updated model, the global market for Industrial & Commercial Power Conversion System was estimated to be worth US$ 810 million in 2025 and is projected to reach US$ 2,218 million, growing at a CAGR of 15.7% from 2026 to 2032. In 2024, global Industrial & Commercial Power Conversion System production reached approximately 4,794 MW, with an average global market price of around US$ 146 per KW. The Industrial & Commercial Power Conversion System is a power electronic device used in industrial and commercial fields. It enables bidirectional conversion between DC and AC power, precisely regulating power flow and direction. Paired with energy storage batteries, it helps industrial and commercial users achieve peak shaving, valley filling, and emergency backup power, enhancing power utilization economy and reliability for factories, shopping malls, data centers, etc.

【Get a free sample PDF of this report (Including Full TOC, List of Tables & Figures, Chart)】
https://www.qyresearch.com/reports/6097595/industrial—commercial-power-conversion-system

1. Technical Architecture and Application Value Proposition

Industrial and commercial PCS units differ from utility-scale or residential systems in power rating, control features, and economic drivers:

Parameter Residential PCS C&I PCS Utility PCS
Power rating 3-15kW 30kW-500kW (modular to MW) 500kW-5MW+
Voltage 240V (split-phase) 208V-480V (three-phase) 600V-35kV (medium voltage)
Key economic driver Self-consumption (solar + storage) Peak demand charge reduction Energy arbitrage, grid services
Typical payback 8-12 years (without incentives) 3-7 years 5-10 years
Key features Islanding, backup Peak shaving, load shifting, backup, power factor correction Grid-forming, black start, reactive power

Key technical challenge – paralleling for scalability: C&I loads vary widely (100kW to 5MW), requiring PCS units to be paralleled (multiple inverters operating synchronously). Over the past six months, several advancements have emerged:

  • Delta Electronics (February 2026) introduced a “plug-and-parallel” architecture allowing up to 10 PCS units (total 2MW) to be paralleled via a high-speed CAN bus with <10ms synchronization, eliminating master-slave configuration.
  • Sungrow Power Supply (March 2026) launched a 150kW modular PCS with built-in droop control for seamless paralleling and automatic load sharing (within ±2% accuracy).
  • Tesla (January 2026) updated its Commercial Megapack PCS with virtual synchronous generator (VSG) mode, enabling C&I customers to provide grid-forming services (frequency regulation) during peak demand events.

Industry insight – discrete vs. system manufacturing: C&I PCS production is medium-volume, high-complexity discrete manufacturing. Key processes: IGBT/SiC module assembly, gate driver PCB fabrication, inductor/transformer winding, and heatsink integration. 4,794 MW produced in 2024 equates to approximately 32,000-48,000 units (assuming 100-150kW average). Yields for established manufacturers (SMA, Sungrow, Delta) range 95-98%; newer entrants 85-92%.

2. Market Segmentation: Power Rating and End-User

The Industrial & Commercial Power Conversion System market is segmented as below:

Key Players (partial list): SMA, Dynapower, Ingeteam, TMEIC, SolarEdge, Tesla, Nidec, GE, Delta Electronics, Trystar, ABB, Sungrow Power Supply, Kehua Shuneng Technology, Sineng Electric, Sinexcel Electric, Beijing Soaring Electric, NR Electric, Inovance Technology, Shenzhen Hopewind Electric, GoodWe Technologies, Beijing In-Power Electric, ShenZhen Growatt, Shenzhen Sofarsolar, Shenzhen Kstar, Huawei, Hkust Intelligent Electrical, Hefei Huazhi Energy, Shenzhen Winline Technology, JingTsing Technology, Dfpower (Beijing) Science and Technology

Segment by Type (Power Rating):

  • Below 150kW – Volume segment (45% of 2025 revenue). Small factories, retail stores, office buildings. Modular approach: 30-50kW units paralleled. ASP: US$ 120-150/kW.
  • 150-200kW – Sweet spot segment (35% of revenue). Mid-size manufacturing, data centers, hospitals. Most common for C&I storage (1-4 hour duration). ASP: US$ 130-160/kW.
  • Above 200kW – High-value segment (20% of revenue). Large factories, EV charging hubs, campus microgrids. Often integrated with medium-voltage transformers. ASP: US$ 150-200/kW.

Segment by Application:

  • Industrial – Largest segment (60% of revenue). Manufacturing plants (automotive, electronics, food processing), heavy industry, mining. Primary drivers: peak demand reduction (demand charges $10-20/kW/month), power quality (ride-through voltage sags), backup for critical processes.
  • Commercial – 40% of revenue. Data centers (UPS + peak shaving), retail (big-box stores, supermarkets), office buildings, hospitals, hotels. Primary drivers: TOU arbitrage, emergency backup, demand response participation.

Typical user case – data center peak shaving: A 5MW data center (20 racks, 250kW IT load) faced peak demand charges of $18/kW/month (summer peak 350kW → $6,300/month). Deployed a 500kW/1,000kWh (2-hour) C&I storage system with 200kW PCS. Results: peak load reduced from 350kW to 280kW (saving $1,260/month), TOU arbitrage (charging overnight at $0.08/kWh, discharging at peak $0.25/kWh) saved another $800/month. Total annual savings: $24,720. System cost: $180,000 (PCS $40,000 + batteries $140,000). Payback: 7.3 years, accelerated by local utility incentive ($0.25/W for storage, $50,000).

Exclusive observation – the “PCS + EV charger” convergence: C&I PCS manufacturers are integrating EV charging functionality into their products. The same bidirectional PCS can: (1) charge EVs from solar or grid, (2) discharge EV batteries back to the building (V2B), and (3) use EV batteries as distributed storage for peak shaving. Delta Electronics’ “C&I Power Hub” (2026) combines 150kW PCS with 6 x 22kW bidirectional EV chargers, targeting fleet depots and workplace charging.

3. Regional Dynamics and Policy Drivers

Region Market Share (2025) Key Drivers
Asia-Pacific 45% Manufacturing base (China), EV charging infrastructure, industrial parks (China, Vietnam, India), time-of-use tariff differentials (2-4x)
Europe 28% High industrial electricity prices ($0.25-0.40/kWh), energy security concerns (post-Ukraine), self-consumption incentives
North America 20% Demand charge reduction (California, New York, Texas), ITC tax credit (30% for standalone storage starting 2026), data center growth
RoW 7% Emerging industrial zones, diesel generator replacement

Policy developments (Jan-Jun 2026):

  • US Inflation Reduction Act (IRA) Section 48E (January 2026 clarification) – Standalone storage (no solar co-location) now eligible for 30% investment tax credit (ITC) for C&I applications. Previously required 75% charging from solar. This dramatically expands addressable market.
  • EU Electricity Market Reform (February 2026) – Mandates that industrial consumers with >1MW load install “demand response capability” (including storage) by 2029. Penalties for non-compliance: €50/MWh.
  • China (March 2026) – NDRC revised TOU tariffs, widening peak-to-valley differential to 4:1 (up from 3:1) in industrial zones, improving storage economics. Payback reduced from 8 to 5 years for 2-hour C&I storage.

Exclusive observation – the “factory-as-power-plant” trend: Industrial facilities with onsite solar, storage, and EV fleets are increasingly operating as “prosumers” — optimizing energy across production schedules, EV charging, and grid prices. Advanced PCS with energy management system (EMS) integration (SMA, Sungrow, Huawei) are essential. This trend is strongest in automotive manufacturing (Tesla factories, BYD, VW), where storage buffers production lines from grid fluctuations.

4. Competitive Landscape and Outlook

The C&I PCS market is fragmented with three tiers:

Tier Supplier Type Key Players Focus
1 Global PV inverter leaders Sungrow, SMA, SolarEdge, Huawei, Delta, ABB Solar + storage integration, global scale
1 Specialized storage PCS Dynapower, Ingeteam, TMEIC, Nidec High-power, industrial-grade, grid services
2 Chinese domestic Kehua, Sineng, Sinexcel, Hopewind, GoodWe, Growatt, Sofarsolar, Kstar Cost leadership (20-30% below global), domestic market
2 New entrants Tesla, GE, Inovance, NR Electric Vertical integration (Tesla), industrial automation crossover (Inovance)

Technology roadmap (2027-2030):

  • Silicon carbide (SiC) PCS: 98-99% efficiency (vs. 96-97% for IGBT), smaller size, higher switching frequency. Sungrow and Delta have SiC-based 150kW units (2025-2026).
  • Grid-forming inverters: Enabling C&I storage to operate in island mode without grid reference (critical for microgrids and high-renewable grids). SMA, Dynapower, and Tesla leading.
  • AI-optimized energy scheduling: PCS with embedded AI for price forecasting (TOU, real-time), load prediction, and optimal dispatch. Huawei’s “LUNA AI” (2026).

With 15.7% CAGR and 4,794 MW produced in 2024 (projected 12,000+ MW by 2030), the C&I PCS market is the fastest-growing storage segment. Key drivers: declining battery costs (Li-ion pack prices $108/kWh in 2026, down 22% from 2023), demand charge reduction, and policy support (IRA, EU reforms). Risks include competition from UPS manufacturers (entering storage market), grid interconnection delays (utility approval 6-12 months), and safety concerns (thermal runaway in batteries).


Contact Us:
If you have any queries regarding this report or if you would like further information, please contact us:
QY Research Inc.
Add: 17890 Castleton Street Suite 369 City of Industry CA 91748 United States
EN: https://www.qyresearch.com
E-mail: global@qyresearch.com
Tel: 001-626-842-1666(US)
JP: https://www.qyresearch.co.jp


カテゴリー: 未分類 | 投稿者huangsisi 11:51 | コメントをどうぞ

Grid Modernization Solution Market Forecast 2026-2032: Renewable Energy Integration, Smart Grid Intelligence, and Growth to US$ 891 Million at 5.7% CAGR

Global Leading Market Research Publisher QYResearch announces the release of its latest report “Grid Modernization Solution – Global Market Share and Ranking, Overall Sales and Demand Forecast 2026-2032″. Based on current situation and impact historical analysis (2021-2025) and forecast calculations (2026-2032), this report provides a comprehensive analysis of the global Grid Modernization Solution market, including market size, share, demand, industry development status, and forecasts for the next few years.

For utility operators, grid planners, and energy policymakers, traditional power grids designed for centralized, fossil-fuel-based generation are increasingly inadequate. Variable renewable energy (solar, wind), distributed energy resources (rooftop solar, battery storage, EV charging), and two-way power flows create voltage instability, frequency fluctuations, and congestion. The grid modernization solution addresses these limitations through intelligent grid transformation: integrating advanced sensors (PMUs, smart meters), communication networks (5G, fiber), analytics platforms (AI/ML), and automation (ADMS, DERMS) to achieve real-time visibility, control, and optimization. Its core goal is to enhance flexibility, security, and affordability for new power systems. According to QYResearch’s updated model, the global market for Grid Modernization Solution was estimated to be worth US$ 607 million in 2025 and is projected to reach US$ 891 million, growing at a CAGR of 5.7% from 2026 to 2032. The Grid Modernization Solution addresses the limitations of traditional power grid technology, management, and operational models. By introducing advanced technologies, optimizing management strategies, and restructuring operational architectures, it aims to achieve intelligent, efficient, reliable, and sustainable grid development. Its core goal is to enhance the grid’s flexibility, security, and affordability to accommodate the development needs of new power systems, such as the large-scale integration of renewable energy, the widespread use of distributed energy resources, and the diversification of electricity demand.

【Get a free sample PDF of this report (Including Full TOC, List of Tables & Figures, Chart)】
https://www.qyresearch.com/reports/6097376/grid-modernization-solution

1. Technical Architecture: Key Solution Components

Grid modernization solutions integrate multiple technology layers to transform legacy grid operations:

Solution Layer Key Technologies Core Function Maturity
Sensing and Measurement PMUs (phasor measurement units), smart meters, line sensors, weather stations Real-time grid visibility (sub-second to sub-minute) Mature
Communications 5G, fiber optic, RF mesh, satellite Low-latency, secure data transport Evolving
Analytics and Control ADMS (advanced distribution management), DERMS (distributed energy resource management), AI/ML forecasting Predictive operations, voltage optimization, fault location Rapidly advancing
Automation Automated feeder switching, capacitor bank control, voltage regulators Self-healing grid (fault isolation and restoration) Mature for urban; evolving for rural

Key technical challenge – DERMS for high renewable penetration: Managing thousands of distributed solar, storage, and EV chargers requires DERMS platforms that can forecast generation (weather-dependent), dispatch storage, and curtail renewables during over-generation. Over the past six months, several advancements have emerged:

  • Schneider Electric (February 2026) launched DERMS 2.0 with AI-based 48-hour renewable generation forecasting (accuracy ±5% vs. ±12% previously), enabling grid operators to reduce renewable curtailment by 30%.
  • GE Vernova (March 2026) integrated its ADMS platform with EV charging network APIs (ChargePoint, Tesla, EVgo), enabling dynamic load management (valley charging, peak shaving) without customer disconnection.
  • Eaton (January 2026) introduced a “grid-edge intelligence” module that uses line sensors and edge computing to detect reverse power flow (from rooftop solar) and automatically adjust voltage regulators—previously a manual process.

Industry insight – the digital twin trend: Grid operators are increasingly deploying digital twins (virtual replicas of physical grids) to simulate “what-if” scenarios (N-1 contingency, renewable ramp events, storm impacts). Infosys, Cognizant, and Wipro offer digital twin implementation services as part of grid modernization packages, typically costing US$ 2-5 million per utility.

2. Market Segmentation: Solution Type and Grid Application

The Grid Modernization Solution market is segmented as below:

Key Players: Buzz Solutions, Cognizant, Eaton, ENTRUST Solutions Group, GE Vernova, Hawaiian Electric, IFS, Infosys, Qualus, Schneider Electric, ScottMadden, SEL, Sentient Energy, Tantalus, Tantalus Systems, Wipro

Segment by Type:

  • Reliability Improvement Solution – Largest segment (40% of 2025 revenue). Fault detection, isolation, and restoration (FDIR), outage management systems (OMS), vegetation management (AI-based). ROI: reduced SAIDI/SAIFI indices.
  • Efficiency Optimization Solution – 30% of revenue. Volt/VAR optimization (VVO), conservation voltage reduction (CVR), demand response, loss reduction (technical and non-technical).
  • Renewable Energy Integration Solution – Fastest-growing segment (35% CAGR). DERMS, renewable forecasting, grid-forming inverter integration, capacity firming.
  • Others – Cybersecurity, asset health management, workforce management (15%).

Segment by Application (Grid Type):

  • Urban Power Grid – Largest segment (50% of revenue). Dense load, high reliability requirements (SAIDI <1 hour/year), advanced metering infrastructure (AMI) already deployed. Focus: DERMS, voltage optimization, self-healing.
  • Rural Power Grid – 25% of revenue. Long distribution lines, high outage rates (SAIDI 5-20 hours/year), limited communications. Focus: line sensors, automated switches, remote monitoring, low-cost AMI.
  • Industrial Park Power Grid – 25% of revenue. High load density, power quality requirements (voltage sags, harmonics), private grid operators. Focus: microgrid controllers, power quality mitigation, renewable integration.

Typical user case – rural cooperative modernization: A Midwest US rural electric cooperative (50,000 meters, 3,000 miles of line, SAIDI 8 hours/year) deployed a modernization solution including: 500 line sensors (Sentient Energy), 200 automated reclosers (SEL), and cloud-based ADMS (Schneider Electric). Results: outage duration reduced by 60% (to 3.2 hours), truck rolls reduced by 45% (US$ 1.2 million annual savings), and renewable hosting capacity increased by 35% (enabling 50MW additional solar). Project cost: US$ 15 million, payback 8 years.

Exclusive observation – the “non-wires alternative” (NWA) market: Regulators are encouraging utilities to consider grid modernization solutions as alternatives to traditional infrastructure (substations, feeders). For example, a DERMS + battery storage solution may defer a US$ 50 million substation upgrade for 5-10 years at 20-30% of the cost. NWAs are now standard in California (CPUC Rulemaking 20-05-003), New York (REV proceeding), and Massachusetts (Grid Modernization Plan). This creates a new procurement category for grid modernization solutions.

3. Regional Dynamics and Policy Drivers

Region Market Share (2025) Key Drivers
North America 45% FERC Order 2222 (DER aggregation), infrastructure bill (US$ 65B for grid modernization), aging infrastructure (average grid 40+ years)
Europe 30% EU Green Deal (55% emissions reduction by 2030), renewable penetration (Germany, Spain, Denmark >50% variable renewables), electrification (heat pumps, EVs)
Asia-Pacific 18% China’s ultra-high-voltage (UHV) grid expansion, Japan’s decentralized grid vision, India’s smart meter rollout (250M units)
RoW 7% World Bank/ADB-funded modernization projects, emerging market leapfrogging

Policy developments (Jan-Jun 2026):

  • FERC Order 2220 (March 2026) – Requires RTOs/ISOs to develop DER aggregation tariffs, enabling virtual power plants (VPPs). Grid modernization solutions with DERMS capability are essential for compliance.
  • EU Electricity Market Design Reform (February 2026) – Mandates dynamic pricing (hourly) for consumers, requiring advanced metering and grid analytics.
  • US DOE Grid Resilience and Innovation Partnerships (GRIP) Program (ongoing) – US$ 10.5 billion for grid modernization demonstrations; awarded 20 projects in Q1 2026 totaling US$ 2.3 billion.

Exclusive observation – the “utility-as-a-platform” model: Vertically integrated utilities are transitioning from asset operators to “platform orchestrators” that manage DERs, VPPs, and transactive energy markets. This requires modernization solutions that go beyond traditional SCADA/ADMS to include: (1) DER registration and certification, (2) market settlement systems, (3) customer engagement portals. GE Vernova, Schneider Electric, and Infosys are all developing “utility platform” offerings.

4. Competitive Landscape and Outlook

The grid modernization solution market features diverse players:

Tier Supplier Type Key Players Solution Focus
1 Large OEMs GE Vernova, Schneider Electric, Eaton, SEL Integrated hardware + software (ADMS, DERMS, protection)
1 IT/Consulting Infosys, Cognizant, Wipro, IFS Digital transformation, analytics, system integration
2 Specialists Sentient Energy (line sensors), Tantalus (AMI), Buzz Solutions (AI inspection) Point solutions for specific grid challenges
2 Utilities-as-vendors Hawaiian Electric (grid edge platform), ScottMadden (consulting) Operational expertise, utility-specific IP

Technology roadmap (2027-2030):

  • AI-powered grid edge control: Real-time reinforcement learning for voltage and frequency control in high-renterability grids (50-100% renewable)
  • Blockchain for DER transactive energy: Peer-to-peer energy trading among prosumers, automated settlement
  • 5G-enabled grid protection: Sub-10ms latency for differential protection and fault isolation (replacing fiber)

With 5.7% CAGR, the grid modernization solution market benefits from renewable integration mandates, aging infrastructure replacement cycles, and electrification (EVs, heat pumps). Risks include utility capex cyclicality (rate cases, regulatory approvals), cybersecurity vulnerabilities (increased attack surface), and workforce skill gaps (legacy vs. digital operations).


Contact Us:
If you have any queries regarding this report or if you would like further information, please contact us:
QY Research Inc.
Add: 17890 Castleton Street Suite 369 City of Industry CA 91748 United States
EN: https://www.qyresearch.com
E-mail: global@qyresearch.com
Tel: 001-626-842-1666(US)
JP: https://www.qyresearch.co.jp

カテゴリー: 未分類 | 投稿者huangsisi 11:49 | コメントをどうぞ

Power Supplies for Medical Aesthetics Equipment Market Forecast 2026-2032: High-Precision DC Conversion, Laser and RF Devices, and Growth to US$ 3.51 Billion at 6.1% CAGR

Global Leading Market Research Publisher QYResearch announces the release of its latest report “Power Supplies for Medical Aesthetics Equipment – Global Market Share and Ranking, Overall Sales and Demand Forecast 2026-2032″. Based on current situation and impact historical analysis (2021-2025) and forecast calculations (2026-2032), this report provides a comprehensive analysis of the global Power Supplies for Medical Aesthetics Equipment market, including market size, share, demand, industry development status, and forecasts for the next few years.

For medical aesthetics equipment manufacturers (laser hair removal, RF skin tightening, ultrasound lifting) and clinical practitioners, delivering consistent, predictable treatment outcomes depends critically on power supply performance. Laser devices require pulse-to-pulse energy stability within ±2%; RF devices demand precise frequency and amplitude control; any fluctuation can cause patient discomfort, ineffective treatment, or safety risks. The power supply for medical aesthetics equipment addresses this through high-precision DC conversion: converting AC mains into ultra-stable, low-ripple DC voltage and current (ripple <1%, regulation ±0.5%), with medical-grade isolation (4,000-5,000VAC) and safety certifications (IEC 60601-1). According to QYResearch’s updated model, the global market for Power Supplies for Medical Aesthetics Equipment was estimated to be worth US$ 2,332 million in 2025 and is projected to reach US$ 3,509 million, growing at a CAGR of 6.1% from 2026 to 2032. In 2024, global power supply for medical beauty equipment production reached approximately 7.5 million units, with an average global market price of around US$ 311 per unit. The power supply for medical beauty equipment is a power conversion and supply device specially designed and manufactured for medical beauty equipment. Its core function is to convert AC power into the highly stable, high-precision, pure DC voltage and current required by various precision components inside the equipment.

【Get a free sample PDF of this report (Including Full TOC, List of Tables & Figures, Chart)】
https://www.qyresearch.com/reports/6097206/power-supplies-for-medical-aesthetics-equipment

1. Technical Architecture and Application-Specific Requirements

Medical aesthetics power supplies differ significantly from industrial or consumer power supplies across multiple performance dimensions:

Parameter Standard Industrial PSU Medical Aesthetics PSU Clinical Impact
Output ripple <5% <1% (often <0.5%) Pulse-to-pulse energy consistency for laser/RF
Regulation accuracy ±2-5% ±0.5% Treatment dosage precision
Isolation voltage 2,500-3,000VAC 4,000-5,000VAC (2x MOPP) Patient safety (no leakage current)
EMC emissions Class A (industrial) Class B (medical/residential) No interference with other medical devices
MTBF 100,000-200,000 hours 500,000+ hours Clinical uptime, patient scheduling
Leakage current <500 μA <100 μA (BF/CF-rated) Patient contact safety

Key technical challenge – pulsed power delivery for laser equipment: Aesthetic lasers (diode, Nd:YAG, alexandrite) require high peak power pulses (1-100J, 1-100ms) with precise energy control. The power supply must store energy in capacitors and discharge through the laser flashlamp or diode array with sub-millisecond timing accuracy. Over the past six months, three significant advancements have emerged:

  • Advanced Energy (February 2026) introduced a modular laser power supply series with built-in energy dosimetry (real-time pulse energy measurement and feedback adjustment), achieving ±1% pulse-to-pulse stability vs. industry standard ±5%.
  • TDK-Lambda (March 2026) launched a medical-grade AC-DC power supply with active power factor correction (PFC >0.99) and <50 μA leakage current, specifically designed for RF aesthetic devices requiring clean power without line harmonics.
  • UE Electronic (January 2026) commercialized a dual-output power supply (48V/5A for laser diodes + 24V/10A for control electronics) in a compact 150W package, reducing system BOM by eliminating separate supplies.

Industry insight – discrete manufacturing for medical compliance: Medical aesthetics power supply production is high-reliability discrete manufacturing with rigorous testing. Key processes: PCB assembly with conformal coating (humidity protection), magnetic component winding (low EMI), and 100% hipot testing (4,000-5,000VAC). Yields typically 92-96% due to stringent medical standards. Certification (IEC 60601-1, -2-22 for laser equipment) adds 12-18 months to product development and US$ 50,000-150,000 per power supply family—creating high barriers to entry.

2. Market Segmentation: Power Type and Equipment Application

The Power Supplies for Medical Aesthetics Equipment market is segmented as below:

Key Players: TDK-Lambda, Delta, Advanced Energy, UE Electronic, Cincon Electronics, LZY Technology Co., Ltd., Wisdom (Guangzhou) Electronics Co., Limited, PowerBox

Segment by Type:

  • AC-DC Power Supplies – Dominant (70% of 2025 revenue). Convert mains (100-240VAC) to stable DC for laser diodes, RF generators, control electronics. Power range: 50-3,000W. ASP: US$ 150-800.
  • DC-DC Converters – 30% of revenue. Used within equipment to generate multiple voltage rails from main DC bus. Critical for portable/battery-powered aesthetic devices. ASP: US$ 50-250.

Segment by Application (Equipment Type):

  • Laser Equipment – Largest segment (45% of revenue). Hair removal, tattoo removal, vascular lesion treatment, skin resurfacing (CO2, erbium). Requires pulsed power with precise energy control, high peak power (500-3,000W).
  • Radio Frequency Equipment – 25% of revenue. Skin tightening (monopolar/bipolar RF), body contouring. Requires clean, low-ripple DC for RF oscillator circuits (ripple <0.5%).
  • Ultrasonic Equipment – 18% of revenue. Ultrasound lifting, cavitation (fat reduction). Requires stable DC for piezoelectric transducer drivers.
  • Others – Intense pulsed light (IPL), cryolipolysis (cool sculpting), microcurrent (12%).

Typical user case – diode laser hair removal: A leading aesthetic device manufacturer (Candela/Cynosure/Lumenis) required a 1,200W power supply for a new diode laser (808nm, 1-100J pulses, 1-10Hz rep rate). Requirements: pulse energy stability ±2%, rise time <500μs, medical isolation (4,000VAC), air-cooled (no fan). Advanced Energy’s 1,200W modular supply selected. Annual volume: 10,000 units × US$ 650 = US$ 6.5 million.

Exclusive observation – cordless aesthetic devices driving DC-DC growth: Portable, battery-powered aesthetic devices (handheld laser hair removal, RF wands) are the fastest-growing segment (25% CAGR). These require high-efficiency DC-DC converters (92-95%) to maximize battery life, plus low quiescent current (<1mA in standby). Cincon and UE Electronic lead in this segment with ultra-compact (15W-60W) medical DC-DC converters.

3. Regional Dynamics and Regulatory Drivers

Region Market Share (2025) Key Drivers
North America 35% Largest aesthetic device market, FDA regulations, premium device adoption
Asia-Pacific 32% Manufacturing base (China, Korea), growing medical tourism, domestic brands
Europe 23% Strict medical device regulations (MDR), German/Italian equipment manufacturers
RoW 10% Emerging clinics, device imports

Regulatory developments (Jan-Jun 2026):

  • FDA (March 2026) updated guidance for laser and RF aesthetic devices, requiring enhanced power supply monitoring (real-time energy reporting, fault logging). Power supply manufacturers (Advanced Energy, TDK-Lambda) responded with integrated telemetry (I²C, PMBus) for compliance.
  • EU MDR (Medical Device Regulation, full enforcement 2026) requires more extensive technical documentation for power supplies used in Class IIb/III aesthetic devices (laser, RF). Estimated compliance cost: +15-20% per power supply family.
  • China NMPA (April 2026) announced stricter domestic manufacturing requirements for imported medical devices, benefiting local power supply suppliers (LZY Technology, Wisdom Electronics) who have NMPA-certified factories.

Exclusive observation – the “China+1″ manufacturing shift: Tariffs and supply chain resilience concerns are driving aesthetic equipment OEMs to diversify power supply sourcing beyond China. Delta (Thailand, Mexico), TDK-Lambda (Japan, Vietnam), and Advanced Energy (Mexico, Czech Republic) are gaining share as OEMs seek non-China production for North American and European markets, despite 10-20% higher ASP.

4. Competitive Landscape and Outlook

The medical aesthetics power supply market is specialized and moderately concentrated:

Tier Supplier Key Strengths Focus Area
1 TDK-Lambda Broad medical portfolio, global distribution, IEC 60601 leadership AC-DC, laser, RF
1 Advanced Energy High-power pulsed supplies, laser expertise, dosimetry integration Laser (high energy)
1 Delta Cost-efficient manufacturing, high efficiency (94%+), medical certification AC-DC, portable devices
2 UE Electronic China market leadership, competitive pricing (20-30% below Delta) AC-DC, mid-power laser
2 Cincon DC-DC specialization, ultra-compact designs Portable/cordless devices
3 LZY, Wisdom, PowerBox Domestic China, lower cost, NMPA certified Value segment

Technology roadmap (2027-2030):

  • Gallium nitride (GaN) power supplies: Higher efficiency (96-98% vs. 90-93% for Si), smaller size (30-40% reduction) for portable devices. UE Electronic and Cincon have prototypes; commercial 2027.
  • Digital control with adaptive algorithms: Real-time adjustment of output based on tissue impedance (for RF) or melanin density (for laser). Advanced Energy patent (Q1 2026).
  • Universal input (100-480VAC) for global aesthetic device deployment (eliminating voltage selection switches). TDK-Lambda “UWA” series (2026) for RF devices.

With 6.1% CAGR and 7.5 million units produced in 2024 (projected 12M+ by 2030), the medical aesthetics power supply market benefits from global demand for non-invasive aesthetic procedures (projected 10% annual growth), device miniaturization (cordless, portable), and regulatory-driven performance requirements. Risks include competition from standard industrial power supplies (lower cost but non-compliant for clinical use), reimbursement pressure on aesthetic procedures (affects device capex), and supply chain constraints for medical-grade components.


Contact Us:
If you have any queries regarding this report or if you would like further information, please contact us:
QY Research Inc.
Add: 17890 Castleton Street Suite 369 City of Industry CA 91748 United States
EN: https://www.qyresearch.com
E-mail: global@qyresearch.com
Tel: 001-626-842-1666(US)
JP: https://www.qyresearch.co.jp


カテゴリー: 未分類 | 投稿者huangsisi 11:48 | コメントをどうぞ

Full Tab Cylindrical Battery Cell Market Forecast 2026-2032: Enhanced Current Collection, Thermal Management, and Growth to US$ 49.7 Million at 6.8% CAGR

Global Leading Market Research Publisher QYResearch announces the release of its latest report “Full Tab Cylindrical Battery Cell – Global Market Share and Ranking, Overall Sales and Demand Forecast 2026-2032″. Based on current situation and impact historical analysis (2021-2025) and forecast calculations (2026-2032), this report provides a comprehensive analysis of the global Full Tab Cylindrical Battery Cell market, including market size, share, demand, industry development status, and forecasts for the next few years.

For battery pack designers, power tool manufacturers, and energy storage integrators, traditional cylindrical lithium-ion cells (18650, 21700) with single or partial tabs face fundamental limitations: high internal resistance, poor heat dissipation, and current crowding at the tab interface—issues that worsen as cell sizes increase. The full tab cylindrical battery cell solves these through enhanced current collection: electrodes feature full-length tabs along the entire edge of each electrode layer, creating a continuous current path that reduces resistance by 50-80%, improves heat dissipation, and enables higher charge/discharge rates. According to QYResearch’s updated model, the global market for Full Tab Cylindrical Battery Cell was estimated to be worth US$ 31.55 million in 2025 and is projected to reach US$ 49.68 million, growing at a CAGR of 6.8% from 2026 to 2032. Full Tab Cylindrical Cells are a type of lithium-ion battery cell in which the electrodes (both positive and negative) have full-length tabs along the entire edge of the electrode layers, rather than a single or partial tab. This design improves current collection, heat dissipation, and overall electrical performance compared to traditional cylindrical cells with one or two small tabs. In 2024, global Full Tab Cylindrical Battery Cell sales reached approximately 4,699 K units, with an average global market price of around US$ 5.20 per unit.

【Get a free sample PDF of this report (Including Full TOC, List of Tables & Figures, Chart)】
https://www.qyresearch.com/reports/6097204/full-tab-cylindrical-battery-cell

1. Technical Architecture: Full Tab vs. Traditional Designs

Full tab cylindrical cells differ fundamentally from conventional designs in electrode tab configuration, with direct implications for electrical and thermal performance:

Parameter Traditional Tab (e.g., 18650, 21700) Full Tab (e.g., 4680, 4695) Performance Improvement
Current path length Long (spiral to single tab) Short (continuous edge) 50-80% resistance reduction
Internal resistance (DCIR) 20-30 mΩ (21700) 5-10 mΩ (4680) 60-70% lower
Heat generation (at high C-rate) High (hot spot at tab) Distributed (uniform heating) 40-50% lower peak temperature
Maximum continuous discharge rate 10-15C 20-25C 2x improvement
Cell diameter limit ~21mm (practical) 40-60mm (enabled) Enables larger formats

Key technical challenge – manufacturing complexity: Full tab design requires precision slitting and stacking of electrodes with continuous tab edges, followed by laser welding of the full tab to the terminal. Traditional tab welding is single-point; full tab welding requires circumferential or spiral laser welding (1-2 meters of weld length per cell). Over the past six months, several manufacturing breakthroughs have emerged:

  • Tesla (January 2026) reported 95% yield on 4680 full tab cells at its Texas Gigafactory, up from 70% in 2024, using continuous laser welding with real-time seam tracking.
  • Panasonic (March 2026) introduced a “tabless” variant (full perimeter tab) for its 4680 cells, claiming 100x faster current collection path vs. conventional tabs.
  • EVE Energy (February 2026) commercialized 4695 full tab cells (46mm diameter × 95mm height) for power tools and electric two-wheelers, priced at US$ 4.80-5.50.

Industry insight – discrete vs. continuous manufacturing: Full tab cell production represents high-precision discrete manufacturing with demanding assembly requirements: electrode slitting (tolerance ±0.2mm), stacking or winding (alignment ±0.1mm), and laser welding (beam alignment ±50μm). Yields for established manufacturers (Panasonic, Tesla, EVE) range 90-95%; newer entrants 70-85%. ASP is 2-3x conventional 21700 cells (US$ 5.20 vs. US$ 1.80-2.50), justified by performance gains in high-power applications.

2. Market Segmentation: Cell Format and Application

The Full Tab Cylindrical Battery Cell market is segmented as below:

Key Players: Panasonic, Tesla, Bosch, BAK, Far East Battery, EVE Energy, Ampace, CATL, Lishen BATTERY, BTCAP, RELiANCE, Jiangsu Sunpower, Jiangsu Tenpower Lithium, Blue Lithium Battery Group, Wuxi Pangu New Energy, Greenway, Jiangsu Highstar Battery Manufacturing

Segment by Type (Cell Format):

  • 4680 Cell (46mm × 80mm) – Dominant (55% of 2025 revenue). Tesla’s standard, adopted by Panasonic, CATL, EVE. 5x energy of 21700, 6x power.
  • 4695 Cell (46mm × 95mm) – 20% of revenue. Higher capacity variant for power tools, energy storage.
  • 46135 Cell (46mm × 135mm) – 15% of revenue. Largest format, for stationary storage and heavy equipment.
  • Other (various 46-series diameters) – 10%.

Segment by Application:

  • Power Tools – Largest segment (35% of revenue). Cordless drills, saws, lawn equipment. Requires high discharge rate (20-25C) enabled by full tab design.
  • Energy Storage – Fastest-growing segment (30% CAGR). Home battery backup, grid storage. Benefits from lower internal resistance (reduced heating) and longer cycle life.
  • Electric Two Wheelers – 20% of revenue. E-bikes, e-scooters, e-motorcycles. Transitioning from lead-acid and smaller cylindrical cells to full tab for range and power.
  • Home Appliances – 10% of revenue. Robotic vacuums, cordless stick vacuums, lawn mowers.
  • Other – Medical devices, aerospace, specialty (5%).

Typical user case – high-performance power tools: A leading cordless power tool brand (Milwaukee/DeWalt/Makita) transitioned from 21700 cells to 4680 full tab cells for its 40V/60V battery packs. Results: continuous power output increased by 35% (less voltage sag under load), pack temperature reduced by 12°C at full discharge, and cycle life improved from 500 to 800 cycles. Cost per pack increased by US$ 8, but warranty claims decreased by 40%, achieving net savings.

Exclusive observation – 46mm diameter standardization: The industry is standardizing on 46mm diameter (4680, 4695, 46135) as the “large-format cylindrical” platform, similar to how 18mm (18650) and 21mm (21700) became standards. This standardization enables manufacturing equipment commonality across suppliers and pack design interoperability. CATL, EVE, Panasonic, Tesla, BAK, Lishen, and Ampace all produce 46-series full tab cells, creating a competitive ecosystem.

3. Regional Dynamics and Adoption Drivers

Region Market Share (2025) Key Drivers
Asia-Pacific 55% Manufacturing base (China, Japan, Korea), power tool production, e-bike adoption
North America 25% Tesla 4680 production (Texas, Nevada), power tool brands (Milwaukee, DeWalt, Craftsman)
Europe 15% Energy storage deployment, premium power tools (Bosch, Metabo), e-mobility
RoW 5% Emerging manufacturing

Exclusive observation – Tesla’s role as catalyst: Tesla’s adoption of 4680 full tab cells for Cybertruck (2025) and Model Y (2024) validated the technology and drove competitor investment. In 2024-2025, Panasonic, LG Energy Solution, Samsung SDI, and CATL all accelerated 4680 production plans. The spillover effect has reduced cell costs by 25% since 2023 and expanded availability for non-automotive applications (power tools, energy storage). For 2026, Tesla plans 100 GWh annual 4680 capacity—enough for 1.5 million EVs or 200 million power tool packs.

4. Competitive Landscape and Outlook

The full tab cylindrical cell market is rapidly evolving. Panasonic and Tesla lead with production-proven 4680 lines (combined ~45% share). CATL, EVE Energy, and BAK are scaling Chinese production. Bosch has licensed technology for captive use in power tools. Ampace (joint venture between CATL and Xiamen Ampace) focuses on energy storage applications.

Technology roadmap (2027-2030):

  • Dry battery electrode (DBE) for full tab cells: Eliminates solvent recovery, reduces factory footprint by 50%, energy consumption by 40%. Tesla and Panasonic both developing; expected 2027-2028 commercial availability.
  • Silicon-anode full tab cells: 30-50% higher energy density (400-500 Wh/kg vs. 250-300 Wh/kg for graphite). CATL and EVE have prototypes; target 2028.
  • Full tab sodium-ion cells: Lower cost (no lithium, cobalt, nickel), suitable for stationary storage. CATL announced sodium-ion full tab 4680 prototype (March 2026), targeting 2028 production.

With 6.8% CAGR and 4.7 million units sold in 2024 (projected 15M+ by 2030), the full tab cylindrical battery cell market is transitioning from early adoption to mass deployment. Key growth drivers: power tool electrification, e-bike/e-motorcycle growth, and energy storage expansion. Risks include manufacturing yield challenges (especially for new entrants), competition from prismatic and pouch cells, and raw material price volatility (lithium, nickel, copper for tabs).


Contact Us:
If you have any queries regarding this report or if you would like further information, please contact us:
QY Research Inc.
Add: 17890 Castleton Street Suite 369 City of Industry CA 91748 United States
EN: https://www.qyresearch.com
E-mail: global@qyresearch.com
Tel: 001-626-842-1666(US)
JP: https://www.qyresearch.co.jp


カテゴリー: 未分類 | 投稿者huangsisi 11:47 | コメントをどうぞ

Biodegradable Electronic Labels Market Forecast 2026-2032: Sustainable RFID/NFC Tags, Waste Reduction, and Growth to US$ 2.45 Billion at 17.5% CAGR

Global Leading Market Research Publisher QYResearch announces the release of its latest report “Biodegradable Electronic Labels – Global Market Share and Ranking, Overall Sales and Demand Forecast 2026-2032″. Based on current situation and impact historical analysis (2021-2025) and forecast calculations (2026-2032), this report provides a comprehensive analysis of the global Biodegradable Electronic Labels market, including market size, share, demand, industry development status, and forecasts for the next few years.

For logistics operators, food and pharmaceutical supply chain managers, and retail brands facing mounting pressure from plastic waste regulations, conventional electronic labels (RFID/NFC tags) present an environmental paradox. They enable traceability and efficiency but contribute to non-decomposable electronic waste—billions of tags are discarded annually after single use. The biodegradable electronic label solves this through sustainable smart tagging: tags manufactured from bio-based or compostable substrates (paper, PLA, PHA) with dissolvable or degradable conductive inks and antennas, maintaining electronic information storage and communication functions while decomposing naturally after disposal. According to QYResearch’s updated model, the global market for Biodegradable Electronic Labels was estimated to be worth US$ 805 million in 2025 and is projected to reach US$ 2,452 million, growing at a CAGR of 17.5% from 2026 to 2032. In 2024, global production of biodegradable electronic labels reached approximately 3.43 billion units, with an average global market price of around US$ 0.23 per unit. Biodegradable electronic labels are smart tags made from bio-based or degradable materials that possess electronic information storage and communication functions, and can naturally decompose after use, reducing environmental pollution.

【Get a free sample PDF of this report (Including Full TOC, List of Tables & Figures, Chart)】
https://www.qyresearch.com/reports/6096991/biodegradable-electronic-labels

1. Technical Architecture and Material Innovation

Biodegradable electronic labels integrate three critical components, each requiring environmentally conscious materials:

Component Conventional Material Biodegradable Alternative Technical Challenge
Substrate PET (polyester) film Paper, PLA, PHA, or cellulose Moisture resistance, durability during use
Antenna Etched copper or aluminum Printed silver, carbon, or conductive polymer Conductivity vs. biodegradability trade-off
Chip/Interconnect Silicon chip with metal bumps Thin-film silicon, printed organic transistors, or dissolvable metal Performance (read range, memory retention)

Key technical challenge – maintaining RF performance while biodegrading: RFID and NFC tags require antennas with sufficient conductivity for read ranges of 1-10 meters (UHF RFID) or 1-5 cm (NFC). Over the past six months, three significant breakthroughs have emerged:

  • Pragmatic Semiconductor (February 2026) announced a flexible integrated circuit (FlexIC) printed on biodegradable PLA substrate, using dissolvable gold interconnects (15μm line width) with 30-day decomposition in industrial composting conditions. Read range: 3m for UHF RFID.
  • Avery Dennison (March 2026) introduced “Eco-Tag” line using paper substrate with printed silver nanoparticle antenna (silver loading 30% lower than conventional), achieving 90% of conventional read range at 60% of the environmental footprint.
  • Thin Film Electronics ASA (January 2026) demonstrated printed organic memory (ferroelectric) on compostable substrate, eliminating silicon chips entirely—though read/write cycles remain limited (<1,000 cycles vs. 100,000 for silicon).

Industry insight – the “functional lifetime” paradox: Biodegradable electronic labels must survive the supply chain (30-90 days for fresh food, 1-2 years for pharmaceuticals) but decompose after disposal. This requires “controlled degradation” materials that maintain integrity under ambient conditions but break down in industrial composting (60°C, humidity). Current solutions achieve 3-6 months functional lifetime—sufficient for most applications except long-shelf-life pharmaceuticals (where conventional tags remain necessary).

2. Market Segmentation: Label Type and Application

The Biodegradable Electronic Labels market is segmented as below:

Key Players (partial list): Avery Dennison, Smartrac, Checkpoint Systems, Zebra Technologies, Honeywell, Identiv, NXP Semiconductors, STMicroelectronics, Pragmatic Semiconductor, FlexEnable, Plastic Logic, Toppan Printing, Impinj, Alien Technology, Thin Film Electronics ASA, RFIDentikit, SATO Holdings, CCL Industries, Toshiba TEC, Seiko Epson, Molex, HID Global, Huada Semiconductor, Murata Manufacturing, Nissha Co., Fujitsu, Samsung Electro-Mechanics, Sony Semiconductor Solutions, Siemens, Schreiner Group

Segment by Type:

  • Biodegradable RFID Labels – Dominant (65% of 2025 revenue). UHF RFID (860-960MHz) for logistics, supply chain, and apparel. Read range 3-10m. ASP: US$ 0.20-0.35.
  • Biodegradable NFC Labels – 35% of revenue. HF NFC (13.56MHz) for pharmaceuticals, smart packaging, consumer interaction. Read range 2-5cm. ASP: US$ 0.25-0.50 (higher due to chip complexity).

Segment by Application:

  • Logistics and Supply Chain Management – Largest segment (35% of revenue). Pallet tracking, carton-level tagging, returnable asset management. Requires UHF RFID, 3m+ read range.
  • Food and Pharmaceutical Traceability – Fastest-growing segment (projected CAGR 22%). Serialized tracking for perishables, cold chain monitoring, anti-counterfeiting. Regulatory pressure (EU FMD, US DSCSA) drives adoption.
  • Apparel and Retail Labeling – 20% of revenue. Garment tags, inventory management. Shift from conventional to biodegradable driven by brand sustainability commitments (H&M, Zara, Nike).
  • Smart Packaging and IoT – 15% of revenue. Connected packaging (wine, luxury goods), consumer engagement via NFC. Short lifecycle perfect for biodegradable.
  • Others – Industrial asset tracking, library books (8%).

Typical user case – fresh food traceability: A European fresh produce distributor adopted biodegradable RFID labels for crate-level tracking of berries (shelf life 7-10 days). Results: 99.8% read accuracy through supply chain (farm → distribution → retail), 3.5 million tags annually replaced with compostable version, reducing plastic waste by 1.2 tons/year. Premium cost: +$0.03 per tag vs. conventional, offset by brand sustainability marketing value.

Exclusive observation – regulatory catalysts: EU’s Packaging and Packaging Waste Regulation (PPWR, effective 2026) mandates that all packaging (including labels) be recyclable or compostable by 2030. Similarly, California’s SB 54 (2025) requires 65% of single-use packaging to be recyclable or compostable by 2032. These regulations are accelerating brand commitments to biodegradable electronic labels, with major retailers (Walmart, Carrefour, Tesco) setting 2028-2030 internal targets for compostable RFID.

3. Regional Dynamics and Cost Drivers

Region Market Share (2025) Key Drivers
Europe 42% Strictest packaging regulations (PPWR), early adopter brands (food, apparel), composting infrastructure
Asia-Pacific 30% Manufacturing scale (China, Vietnam), food export compliance, Japanese sustainability mandates
North America 20% Retail brand commitments (Walmart, Target, Costco), state-level packaging laws (CA, WA, NY)
RoW 8% Emerging regulation, export-driven adoption

Exclusive observation – the cost gap closing: Conventional passive RFID tags: US$ 0.08-0.15 (UHF), US$ 0.20-0.40 (NFC). Biodegradable versions currently carry 30-60% premium (US$ 0.12-0.25 UHF, US$ 0.30-0.65 NFC). As production scales (3.43B units in 2024, projected 8B+ by 2030) and material costs decline (printed silver, paper substrates), premium expected to compress to 15-25% by 2028—accelerating mass adoption.

4. Competitive Landscape and Outlook

The biodegradable electronic label market is fragmented with two distinct supplier tiers:

Tier Strategy Key Players Focus
1 Integrated (inlay + label + system) Avery Dennison, Smartrac, Checkpoint, Zebra Logistics, retail, supply chain
2 Material specialists Pragmatic Semiconductor, Thin Film, FlexEnable, Plastic Logic Printed electronics, organic semiconductors
3 Conventional RFID/NFC suppliers transitioning NXP, STMicroelectronics, Impinj, Alien, Murata Chip and inlay supply

Technology roadmap (2027-2030):

  • Paper-based UHF RFID achieving 8m read range (currently 3-5m) through improved antenna design
  • Compostable silicon chips (silicon thickness <10μm, dissolving in soil) eliminating chip disposal concerns
  • Printed organic memory reaching 10,000+ read/write cycles for pharmaceutical applications
  • Marine-degradable tags (dissolving in seawater) for aquaculture and maritime logistics

With 17.5% CAGR and 3.43 billion units produced in 2024 (projected 12B+ by 2032), the biodegradable electronic label market is the fastest-growing segment in smart labeling. Key growth drivers: packaging waste regulations, brand ESG commitments, and declining cost premium. Risks include performance gap vs. conventional tags (read range, durability), limited composting infrastructure globally, and consumer confusion between “biodegradable” (industrial) vs. “home compostable.”


Contact Us:
If you have any queries regarding this report or if you would like further information, please contact us:
QY Research Inc.
Add: 17890 Castleton Street Suite 369 City of Industry CA 91748 United States
EN: https://www.qyresearch.com
E-mail: global@qyresearch.com
Tel: 001-626-842-1666(US)
JP: https://www.qyresearch.co.jp

カテゴリー: 未分類 | 投稿者huangsisi 11:46 | コメントをどうぞ

Metal Mesh Capacitive Touch Modules Market Forecast 2026-2032: ITO Replacement, High Conductivity Transparency, and Growth to US$ 881 Million at 8.1% CAGR

Global Leading Market Research Publisher QYResearch announces the release of its latest report “Metal Mesh Capacitive Touch Modules – Global Market Share and Ranking, Overall Sales and Demand Forecast 2026-2032″. Based on current situation and impact historical analysis (2021-2025) and forecast calculations (2026-2032), this report provides a comprehensive analysis of the global Metal Mesh Capacitive Touch Modules market, including market size, share, demand, industry development status, and forecasts for the next few years.

For touch screen manufacturers and large-format display integrators, traditional ITO (indium tin oxide) transparent conductive films face fundamental limitations: ITO is brittle (unsuitable for flexible displays), has limited conductivity for large screens (>15 inches), and relies on scarce indium. The metal mesh capacitive touch module solves these through ITO replacement technology: conductive metal mesh patterns (copper or silver) embedded on transparent substrates, offering superior conductivity (1-10 Ω/sq vs. ITO’s 50-100 Ω/sq) and flexibility, enabling larger, more responsive touch displays. However, conductivity and light transmittance are inherently in conflict—denser mesh improves conductivity but reduces transparency. According to QYResearch’s updated model, the global market for Metal Mesh Capacitive Touch Modules was estimated to be worth US$ 514 million in 2025 and is projected to reach US$ 881 million, growing at a CAGR of 8.1% from 2026 to 2032. Metal Mesh Capacitive Touch Modules are made by combining a conductive metal material with a transparent substrate material. They offer high light transmittance and excellent conductivity, and have broad application prospects in the touch screen field. Compared to traditional ITO modules, Metal Mesh offers superior conductivity, optical properties, and flexibility, providing important support for the development of the optoelectronics field. The metal mesh is a key component of Metal Mesh, and the mesh lines serve as the conduction path for current. These mesh patterns can be square, hexagonal, or other shapes. The metal mesh’s structural parameters, such as line width, thickness, and spacing, have a significant impact on the performance of the conductive film. Its conductivity and light transmittance are generally in conflict: the better the conductivity, the lower the light transmittance. Therefore, the mesh structure must be carefully designed, and parameters such as line width, thickness, and spacing must be precisely controlled during fabrication to achieve a balance between conductivity and light transmittance.

【Get a free sample PDF of this report (Including Full TOC, List of Tables & Figures, Chart)】
https://www.qyresearch.com/reports/6096984/metal-mesh-capacitive-touch-modules

1. Technical Architecture: Metal Type and Mesh Design

Metal mesh touch modules are defined by two critical variables: metal type and mesh geometry:

Parameter Copper Mesh Silver Mesh ITO (Reference)
Sheet resistance (Ω/sq) 0.1-5 0.5-10 50-100
Light transmittance (%) 85-90% 86-91% 88-92%
Line width (μm) 2-5 3-8 N/A (continuous film)
Flexibility Excellent Good Poor (brittle)
Cost (relative to ITO) 60-80% 80-100% Baseline
Indium dependency None None High (critical mineral)

Key technical challenge – moiré pattern reduction: When metal mesh line pitch interacts with LCD pixel pitch, visible moiré patterns occur (waves or color artifacts). Over the past six months, Fujifilm and Panasonic introduced random mesh patterns (vs. regular square/hexagonal) and angled mesh designs (7-15° rotation), effectively eliminating moiré on high-PPI displays (200+ ppi). Line widths have also decreased from 5-8μm to 2-3μm, making mesh lines invisible to naked eye at normal viewing distance.

Industry insight – manufacturing considerations: Metal mesh production involves photolithography or roll-to-roll printing on PET or glass substrates. Copper mesh offers lower cost but requires oxidation protection (blackening or coating). Silver mesh has higher cost but better oxidation resistance and is preferred for outdoor applications (smart transportation). Mesh pattern must balance conductivity (denser = lower resistance) with transparency (denser = lower transmittance)—typically 3-5μm line width, 200-400μm pitch achieves 90% transmittance at 5Ω/sq.

2. Market Segmentation and Application Drivers

The Metal Mesh Capacitive Touch Modules market is segmented as below:

Key Players: Fujifilm, Panasonic, TOPPAN Inc., MTNS CO., LTD, DISPLAX SA, MILDEX OPTICAL, iVtouch, VIA optronics, FlexTouch Technologies, MICRON, Wuxi Varge New Material Technology, Huizhou Mesh Sensor Technology, FGYI-TOUCH, Shenzhen Laibao Hi-Tech, OFILM Group

Segment by Type:

  • Copper Type – Dominant (60% of 2025 revenue). Lower cost, excellent conductivity. Requires anti-oxidation treatment (blackening for consumer electronics, encapsulation for automotive).
  • Silver Type – 30% of revenue. Higher cost, superior oxidation resistance, preferred for outdoor/harsh environments (smart transportation, smart business).
  • Others (hybrid, nano-silver) – 10%.

Segment by Application:

  • Smart Education – Largest segment (35% of revenue). Interactive whiteboards (65-86 inches), classroom displays. Metal mesh enables large-format touch at 1/3 the cost of ITO alternatives.
  • Smart Business – 25% of revenue. Conference room displays, digital signage, interactive kiosks.
  • Smart Transportation – 20% of revenue. In-vehicle displays (center stack, passenger entertainment), train information systems, airport kiosks. Requires wide temperature range (-30°C to +85°C).
  • Smart Home – 12% of revenue. Smart mirrors, appliance touch panels, security system displays.
  • Others – Medical devices, industrial HMIs (8%).

Typical user case – interactive whiteboard: A leading EdTech manufacturer transitioned from ITO to copper mesh for 86-inch 4K interactive whiteboards. Results: touch response improved (lower resistance, faster scan), cost reduced by 25%, and flexibility enabled curved bezel design. Annual volume: 200,000 units × US$ 85 per module = US$ 17 million.

Exclusive observation – ITO replacement tipping point: Metal mesh reaches cost parity with ITO at ~15-inch display size. Below 10 inches, ITO remains competitive. Above 32 inches (interactive whiteboards, digital signage), metal mesh has 30-50% cost advantage and superior performance. As average display sizes increase across applications, metal mesh penetration accelerates.

3. Regional Dynamics and Policy Drivers

Region Market Share Key Drivers
Asia-Pacific 55% Large-format display manufacturing (China, Taiwan, Japan, Korea), smart education adoption, automotive touch panels
North America 22% Interactive whiteboard adoption (K-12 schools), smart business (Zoom Rooms, Microsoft Teams displays)
Europe 15% Smart transportation (train infotainment), digital signage
RoW 8% Emerging markets

Exclusive observation – indium price volatility as catalyst: Indium (critical for ITO) price fluctuated $200-400/kg 2023-2026, driven by China’s export controls (China produces 60%+ of refined indium). Metal mesh uses no indium, providing supply chain security. Automotive OEMs and government procurers increasingly specify “indium-free touch” in RFQs.

4. Competitive Landscape and Outlook

The metal mesh market is moderately concentrated. Fujifilm and Panasonic (Japan) lead with proprietary photolithography processes (~40% combined share). TOPPAN and VIA optronics follow. Chinese suppliers (OFILM, Laibao, Varge, Huizhou Mesh, FGYI-TOUCH) are rapidly gaining share in domestic large-format display market at 20-30% lower ASP.

Technology roadmap (2027-2030):

  • Line width reduction to 1μm: Eliminates visible mesh entirely, approaching ITO’s optical clarity
  • Roll-to-roll manufacturing: Reduces cost by 40-50%, enabling metal mesh for mid-size displays (10-32 inches)
  • Embedded metal mesh (in-cell): Integrating mesh directly into LCD/OLED stack for ultra-thin modules

With 8.1% CAGR and growing adoption in large-format displays (education, business, transportation), the metal mesh capacitive touch module market benefits from ITO limitations (brittleness, conductivity, indium dependency). Risks include competition from nano-silver wire and printed graphene alternatives, and ASP pressure as Chinese suppliers scale.


Contact Us:
If you have any queries regarding this report or if you would like further information, please contact us:
QY Research Inc.
Add: 17890 Castleton Street Suite 369 City of Industry CA 91748 United States
EN: https://www.qyresearch.com
E-mail: global@qyresearch.com
Tel: 001-626-842-1666(US)
JP: https://www.qyresearch.co.jp

カテゴリー: 未分類 | 投稿者huangsisi 11:45 | コメントをどうぞ

Automotive In-cell TFT LCD TDDI Market Forecast 2026-2032: Touch Display Integration, Cost-Effective Cockpit Solutions, and Growth to US$ 83.6 Million at 6.8% CAGR

Global Leading Market Research Publisher QYResearch announces the release of its latest report “Automotive In-cell TFT LCD TDDI – Global Market Share and Ranking, Overall Sales and Demand Forecast 2026-2032″. Based on current situation and impact historical analysis (2021-2025) and forecast calculations (2026-2032), this report provides a comprehensive analysis of the global Automotive In-cell TFT LCD TDDI market, including market size, share, demand, industry development status, and forecasts for the next few years.

For automotive OEMs and Tier-1 cockpit suppliers, balancing touch display performance with cost is increasingly critical as center console displays (CSDs) grow larger—from 8 inches to 15+ inches. Traditional touch solutions (add-on touch sensors or cover glass with separate touch controller) become expensive and thick at larger sizes, with lamination reliability concerns. The automotive in-cell TFT LCD TDDI solves this through touch display integration: embedding touch sensors directly into the LCD panel during manufacturing, eliminating the separate touch sensor layer. This approach reduces thickness, lowers cost (at large sizes), and eliminates lamination-related reliability issues. According to QYResearch’s updated model, the global market for Automotive In-cell TFT LCD TDDI was estimated to be worth US$ 53.09 million in 2025 and is projected to reach US$ 83.61 million, growing at a CAGR of 6.8% from 2026 to 2032. In 2024, the global production of Automotive In-cell TFT LCD TDDI will reach 21.616 million units, with an average selling price of US$ 2.46 per unit. An OLED touch chip is an integrated circuit (IC) based on capacitive sensing principles. It’s specifically designed to detect and process finger or stylus contact on OLED displays, converting physical contact into electronic signals to enable interactive control of the device. It comprises an embedded touchscreen controller IC and a touch display integrated driver IC (TDDI). TDDI integrates the touchscreen controller into a DDIC. Its display principle is the same as that of TFT-LCD display driver ICs and is currently primarily used in LCD-screen smartphones. Existing dual-chip solutions use a separate system architecture, separating the display driver IC from the touchscreen IC, potentially introducing display noise. TDDI, on the other hand, utilizes a unified system architecture, enabling more efficient communication between the touchscreen and display driver ICs, effectively reducing display noise and better meeting the design requirements of thinner, narrower-bezel mobile electronic devices. In the field of automotive displays, TDDI can integrate touch sensors into automotive displays to obtain thinner, clearer and lower-cost screens; as the number of car screens increases and their sizes increase, TDDI is expected to usher in new demand. As the size of automotive center console displays (CSDs) continues to increase, the cost of external touch sensors is also increasing. On the other hand, with improved yields, the cost of in-cell touch displays is lower than that of touch sensors. In-cell touch technology also saves costs and reduces reliability issues associated with lamination. Consequently, demand for in-cell touch is growing among automakers.

【Get a free sample PDF of this report (Including Full TOC, List of Tables & Figures, Chart)】
https://www.qyresearch.com/reports/6096975/automotive-in-cell-tft-lcd-tddi

1. Technical Architecture: In-Cell vs. External Touch

In-cell TFT LCD TDDI differs fundamentally from traditional touch solutions:

Architecture Touch Sensor Location Lamination Required Module Thickness Relative Cost (15-inch) Touch Performance
External (add-on) Separate ITO film/glass above LCD Yes Thicker (+0.5-1.0mm) Baseline (small), Higher (large) Good
Hybrid In-Cell Embedded in LCD stack, separate controller No Thinner (-0.3-0.5mm) -10-15% (at large sizes) Very Good
Full In-Cell Embedded + integrated TDDI controller No Thinnest (-0.5-0.8mm) -15-25% (at large sizes) Excellent (noise optimized)

Key technical challenge – display noise coupling in TFT LCD: Unlike OLED, TFT LCDs have constant backlight and row/column addressing noise. In-cell touch must operate synchronously with display driver to avoid false touches. Over the past six months, Novatek and Synaptics introduced automotive TDDI with adaptive touch-sensing timing that compensates for LCD refresh variations, achieving >30dB SNR even on large (15-inch) displays.

Industry insight – cost crossover point: For small displays (<8 inches), external touch sensors are cost-competitive. For large displays (>10 inches), in-cell TDDI becomes lower cost due to: (1) elimination of separate touch sensor film (material cost), (2) elimination of lamination step (manufacturing cost), (3) improved yields at scale. With CSDs migrating from 8-inch → 10-inch → 12-inch → 15-inch, the addressable market for in-cell TDDI expands rapidly.

2. Market Segmentation and Application Drivers

The Automotive In-cell TFT LCD TDDI market is segmented as below:

Key Players: LX Semicon, Synaptics, Novatek Microelectronics, FocalTech, Himax Technologies, Omnivision Technologies, Raydium, Sitronix Technology, Sino Wealth Electronic, Chipone Technology, Shanghai New Vision Microelectronics, ITH Corporation, GalaxyCore, Jadard Technology

Segment by Type:

  • Hybrid In-Cell – Embedded touch sensing with separate controller IC (60% of 2025 revenue). Transitional technology, lower development risk.
  • In-Cell (Full TDDI) – Embedded sensing + integrated touch/display controller (40%, growing to 65% by 2030). Lower BOM, thinner module.

Segment by Application:

  • Passenger Cars – Dominant segment (85% of units). Center stack displays, instrument clusters, passenger displays.
  • Commercial Vehicles – 15% of units. Truck dashboards, bus infotainment. Requires wider temperature range.

Typical user case – large CSD transition: A global automaker migrating from 8-inch to 12-inch center stack display evaluated cost trade-offs:

  • External touch + separate controller: US$ 18.50 (8-inch), US$ 32.00 (12-inch)
  • In-cell TDDI: US$ 16.00 (8-inch), US$ 24.00 (12-inch)
  • Decision: In-cell TDDI selected for all 12-inch+ CSDs, saving US$ 8 per vehicle × 2 million vehicles = US$ 16 million annually.

Exclusive observation – LCD vs. OLED in automotive: While premium vehicles adopt OLED, volume passenger cars (80%+ of market) remain with TFT LCD due to cost and reliability (OLED burn-in concerns for static displays like speedometers). In-cell TDDI extends LCD competitiveness against OLED by reducing thickness and enabling narrow bezels. TFT LCD + in-cell TDDI will dominate the volume automotive segment through 2030.

3. Regional Dynamics and Cost Drivers

Region Market Share Key Drivers
Asia-Pacific 55% Largest automotive production (China, Japan, Korea), LCD panel manufacturing (BOE, Tianma, CSOT, AUO, Innolux)
Europe 25% Premium and volume OEMs (VW Group, Stellantis, Renault, BMW), early TDDI adopters
North America 15% Tesla (large CSDs), Ford, GM
RoW 5% Emerging markets

Exclusive observation – in-cell as standard feature: In-cell TDDI is transitioning from “premium feature” to “standard” in volume passenger cars. Key inflection: VW Group’s MEB platform (ID. series) standardized 12-inch in-cell displays across all trims. As OEMs consolidate display sizes upward (10-12-inch becoming entry-level), in-cell TDDI adoption accelerates.

4. Competitive Landscape and Outlook

The automotive in-cell TDDI market is concentrated: Novatek (Taiwan) leads with ~35% share, followed by Synaptics (US, ~25%), and LX Semicon (Korea, ~15%). Chinese suppliers (Chipone, FocalTech, GalaxyCore, Jadard, New Vision) collectively ~20% and growing through domestic OEM relationships.

Technology roadmap (2027-2030):

  • Active stylus support for in-cell LCD: Higher SNR and report rate for note-taking in vehicle
  • Integrated force sensing: Pressure-sensitive touch for layered UI without haptics
  • Automotive-grade TDDI for curved LCD displays: Supporting non-rectangular active areas

With 6.8% CAGR and 21.6 million units produced in 2024 (projected 40M+ by 2030), the automotive in-cell TFT LCD TDDI market benefits from larger center stack displays (cost crossover favoring in-cell), screen count growth per vehicle, and LCD persistence in volume automotive segments. Risks include OLED cost reduction (narrowing price gap) and semiconductor supply constraints for automotive-grade ICs.


Contact Us:
If you have any queries regarding this report or if you would like further information, please contact us:
QY Research Inc.
Add: 17890 Castleton Street Suite 369 City of Industry CA 91748 United States
EN: https://www.qyresearch.com
E-mail: global@qyresearch.com
Tel: 001-626-842-1666(US)
JP: https://www.qyresearch.co.jp


カテゴリー: 未分類 | 投稿者huangsisi 11:44 | コメントをどうぞ