Global Leading Market Research Publisher QYResearch announces the release of its latest report “Immune Function Evaluations – Global Market Share and Ranking, Overall Sales and Demand Forecast 2026-2032”. Based on current situation and impact historical analysis (2021-2025) and forecast calculations (2026-2032), this report provides a comprehensive analysis of the global Immune Function Evaluations market, including market size, share, demand, industry development status, and forecasts for the next few years.
For clinical immunologists, drug developers, and CROs, assessing immune system activity and responsiveness is critical for disease diagnosis, therapy monitoring, and vaccine development. Immune function evaluations address this as a set of laboratory and clinical assessments designed to measure immune activity, responsiveness, and integrity. These evaluations determine how well an individual’s immune system can detect, respond to, and regulate pathogens, abnormal cells, or therapeutic interventions. As immunotherapy expands in oncology, autoimmune diseases, and infectious diseases, demand for comprehensive immune function testing is growing rapidly.
【Get a free sample PDF of this report (Including Full TOC, List of Tables & Figures, Chart)】
https://www.qyresearch.com/reports/6098999/immune-function-evaluations
Market Size and Growth Fundamentals
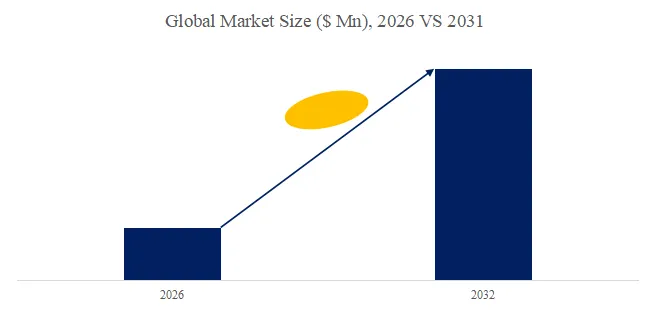
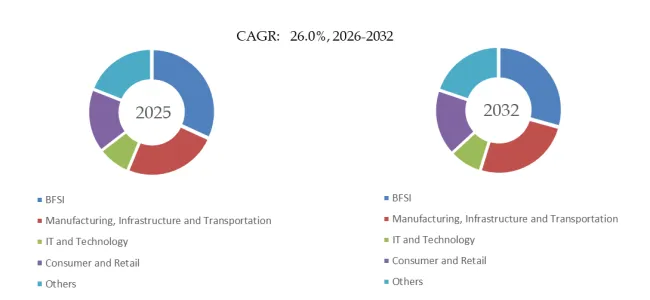
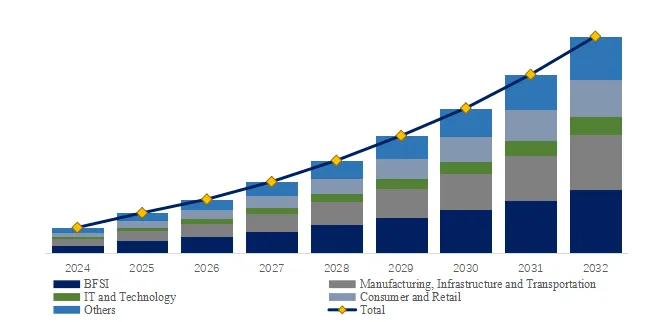
The global immune function evaluations market was valued at US$ 4,992 million in 2025 and is projected to reach US$ 11,820 million by 2032, growing at a CAGR of 13.3% from 2026 to 2032. Growth is driven by expanding immuno-oncology pipelines, demand for immune monitoring in clinical trials, increasing prevalence of autoimmune diseases, and vaccine development.
Service Overview and Evaluation Technologies
Immune function evaluations employ multiple complementary technologies:
- Molecular Detection Technology: PCR-based immune repertoire sequencing (TCR/BCR), gene expression profiling (Nanostring, RNA-seq), cytokine/chemokine quantification (multiplex assays). Measures immune gene expression and repertoire diversity.
- Cell Function Analysis: Flow cytometry (immunophenotyping, T cell activation, intracellular cytokine staining), ELISPOT (antigen-specific T cell response), cytotoxicity assays (NK cell activity, CTL killing). Direct measurement of immune cell function and activation status.
- Others: Serum antibody titers (ELISA), complement assays, phagocytosis assays, and innate immune function tests.
Key evaluation areas:
- T Cell Function: Proliferation, activation, cytokine production, cytotoxicity
- B Cell Function: Antibody production, class switching, memory response
- NK Cell Function: Cytotoxicity, cytokine production
- Innate Immunity: Neutrophil function, monocyte activation, complement activity
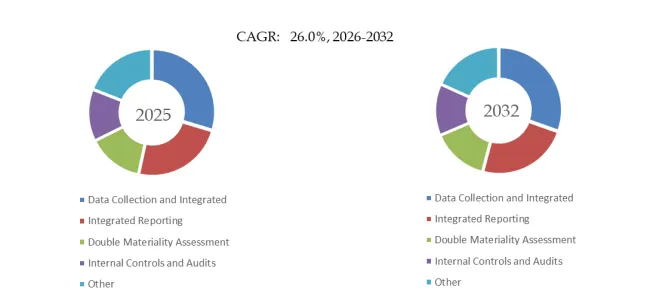
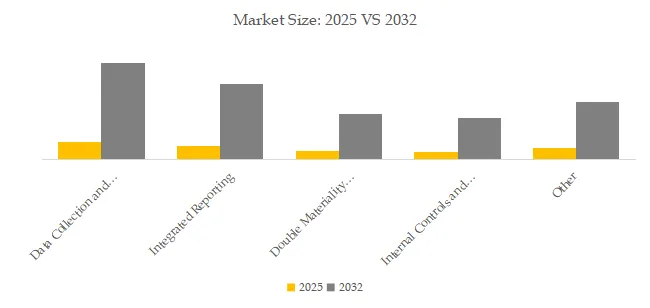
Market Segmentation: Technology Types and Applications
The immune function evaluations market is segmented by technology type into:
- Cell Function Analysis: Largest segment (approximately 45% of market value), including flow cytometry, ELISPOT, and cytotoxicity assays for functional immune assessment
- Molecular Detection Technology: Fastest-growing segment, driven by immune repertoire sequencing and gene expression profiling
- Others: Serological and innate immune function assays
By application, the market spans Clinical Medicine, Pharmaceutical Research and Development, and Others:
- Pharmaceutical R&D: Largest segment (approximately 55%), including clinical trial immune monitoring, vaccine development, and immuno-oncology biomarker discovery
- Clinical Medicine: Diagnostic immunology, disease monitoring, transplantation, and primary immunodeficiency evaluation
- Others: Basic immunology research and public health surveillance
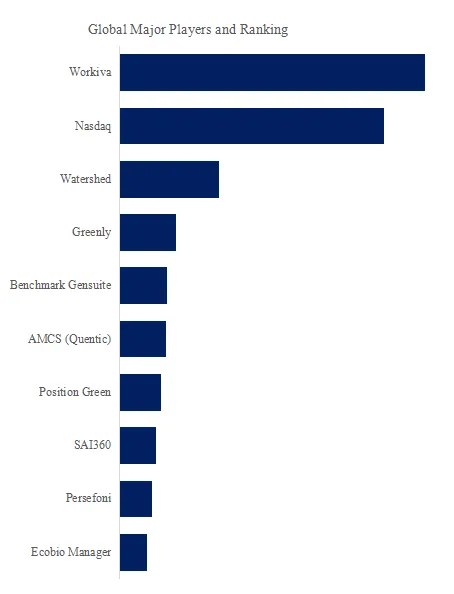
Competitive Landscape: Key Players
The immune function evaluations market features global CROs, specialty immunology laboratories, and diagnostic companies:
| Company | Key Strengths |
|---|---|
| IQVIA | Global CRO leader; clinical trial immune monitoring |
| Labcorp | Diagnostic and clinical trial lab services; immunology |
| Charles River Laboratories | Preclinical and clinical immune function assessments |
| Eurofins | Global lab network; immunology and vaccine testing |
| WuXi AppTec | Chinese CRO; immuno-oncology and vaccine services |
| BioAgilytix | Immunoassay and cell-based potency specialist |
| BRT Laboratories | Immunology reference laboratory |
| Discovery Life Sciences | Biospecimen and immune monitoring services |
| Akoya Biosciences | Spatial biology and immune profiling |
| Taconic Biosciences | Preclinical immune function models |
Recent Developments (Last 6 Months)
Several developments have shaped the immune function evaluations market:
- Immuno-Oncology Expansion: December 2025–January 2026 saw continued growth in immuno-oncology clinical trials (checkpoint inhibitors, CAR-T, bispecifics), driving demand for immune monitoring services.
- Autoimmune Disease Research: Increased focus on autoimmune disease mechanisms and therapeutic development (IL-17, JAK inhibitors) expanded immune function testing applications.
- Vaccine Development: COVID-19 vaccine legacy and emerging vaccine pipelines (RSV, flu, cancer vaccines) maintained demand for T cell and B cell response evaluation.
- Advanced Flow Cytometry: High-parameter flow cytometry (30+ colors) enabled deep immunophenotyping for clinical trials and research.
Exclusive Insight: Cell Function Analysis vs. Molecular Detection—Functional vs. Repertoire Assessment
A critical market dynamic is the divergence between cell function analysis and molecular detection technologies based on information type.
Cell Function Analysis (largest segment) is characterized by:
- Functional Readout: Direct measurement of immune cell activity (proliferation, cytokine production, cytotoxicity)
- Clinical Relevance: Correlates with patient outcomes and therapeutic response
- Applications: Immuno-oncology trials, vaccine response, transplantation monitoring
- Limitation: Requires fresh or recently isolated cells; labor-intensive
Molecular Detection Technology (fastest-growing) is characterized by:
- Repertoire Readout: TCR/BCR diversity, gene expression signatures
- High Throughput: Scalable to hundreds of samples; frozen sample compatible
- Applications: Immune repertoire monitoring, biomarker discovery, large cohort studies
- Limitation: Indirect measure of function; requires bioinformatics
A 2026 industry analysis indicated that cell function analysis remains essential for immuno-oncology trials where functional activity is the primary endpoint. Molecular methods are gaining share for large cohort studies and biomarker discovery where scalability is prioritized.
Technical Challenges and Innovation Directions
Key technical considerations in immune function evaluations include:
- Sample Stability: Immune cell functionality degrades rapidly without proper processing
- Standardization: Assay variability across labs and timepoints affects longitudinal studies
- Multiplexing: Measuring multiple immune parameters from limited sample volumes
- Data Integration: Combining functional, phenotypic, and molecular data for comprehensive assessment
Innovation focuses on:
- High-Parameter Flow Cytometry: 40+ color panels for deep immunophenotyping
- Spatial Biology: Imaging mass cytometry (IMC), CODEX for tissue immune profiling
- Single-Cell Analysis: scRNA-seq, scTCR-seq, scATAC-seq for resolution
- Automated ELISPOT: High-throughput, standardized antigen-specific T cell detection
Conclusion
The immune function evaluations market is positioned for strong growth through 2032, driven by immuno-oncology pipelines, autoimmune research, and vaccine development. For service providers, success will depend on technology breadth (cell function and molecular), regulatory compliance (GCLP, CAP/CLIA), and integration with clinical trial logistics. As immunotherapy advances and immune monitoring becomes standard in drug development, immune function evaluations will remain essential for clinical trials, diagnostics, and research.
Contact Us:
If you have any queries regarding this report or if you would like further information, please contact us:
QY Research Inc.
Add: 17890 Castleton Street Suite 369 City of Industry CA 91748 United States
EN: https://www.qyresearch.com
E-mail: global@qyresearch.com
Tel: 001-626-842-1666(US)
JP: https://www.qyresearch.co.jp