Transcritical CO2 Refrigeration Systems: A Strategic Market Analysis of Natural Refrigerant Adoption, Key Players, and Energy Efficiency Drivers

Global Leading Market Research Publisher QYResearch announces the release of its latest report *”Transcritical CO2 Cycle Refrigeration System – Global Market Share and Ranking, Overall Sales and Demand Forecast 2026-2032″*.

For facility managers, automotive HVAC engineers, and supermarket refrigeration directors, regulatory pressure to phase out hydrofluorocarbon (HFC) refrigerants has created an urgent operational challenge. Legacy R404A, R134a, and R507 systems face rising costs due to dwindling production quotas under the Kigali Amendment to the Montreal Protocol. The proven solution is the transcritical CO2 cycle refrigeration system—a natural refrigerant technology operating at high pressures (up to 140 bar) to deliver efficient cooling, heating, and refrigeration with a global warming potential (GWP) of 1. This report provides strategic intelligence on market size, component segmentation, and growth drivers to inform capital investment and regulatory compliance roadmaps.

【Get a free sample PDF of this report (Including Full TOC, List of Tables & Figures, Chart)】
https://www.qyresearch.com/reports/5764832/transcritical-co2-cycle-refrigeration-system


Market Size & Growth Outlook (2026–2032)

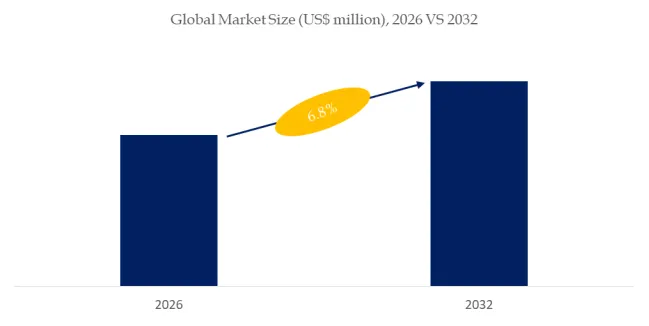
According to QYResearch data, the global market for transcritical CO2 cycle refrigeration systems was valued at approximately USD 3.2 billion in 2025 and is projected to reach USD 7.8 billion by 2032, growing at a compound annual growth rate (CAGR) of 13.6% from 2026 to 2032. This accelerated growth is driven by three converging factors: the accelerating global phase-down of HFC refrigerants under the Kigali Amendment (which entered its final compliance tranche for developed nations in January 2026), improved component reliability and cost reduction, and rising energy efficiency mandates across the EU, North America, and Asia-Pacific.

A transcritical CO2 cycle is defined as a refrigeration or heat pump cycle in which the compressor discharge pressure exceeds the critical pressure of carbon dioxide (73.8 bar). Under these conditions, the refrigerant cannot be condensed via isothermal condensation; instead, it is cooled without phase change in a gas cooler. The cycle operates at high compressor discharge temperatures and pressures (typically 80–120 bar) to enable effective heat exchange with ambient air or water. Unlike subcritical cycles that require a distinct condensing phase, the transcritical approach leverages CO2′s unique thermophysical properties—high volumetric capacity, low viscosity, and excellent heat transfer characteristics—to achieve compact system designs.


Key Industry Characteristics Driving Market Growth

1. Regulatory Acceleration: F-Gas Phase-Down as the Primary Market Catalyst

The regulatory landscape has fundamentally shifted in favor of natural refrigerants. The EU F-Gas Regulation (EU 2024/573), fully effective since January 2025, imposes a steep declining quota for HFCs, with an 80% reduction from 2015 levels by 2030. Similarly, the U.S. American Innovation and Manufacturing (AIM) Act, enforced by the EPA, has progressively restricted HFC production and consumption, with the final 85% step-down scheduled for 2036. In response, leading supermarket chains—including Aldi, Lidl, and Carrefour—have committed to CO2 transcritical systems for all new store openings. In December 2025, Walmart announced a USD 500 million retrofit program to convert 650 U.S. stores to transcritical CO2 systems by 2029, citing a projected 35% reduction in refrigerant-related compliance costs over the decade.

2. Technology Segmentation: Components and Integrated Systems

The report segments the market into four primary technology categories:

  • CO2 Compressors (Approx. 38–42% of market value): The most critical component, requiring specialized designs to handle transcritical pressure differentials and high discharge temperatures (up to 160°C). Leading suppliers—including Bitzer, Danfoss, Mitsubishi Heavy Industries, and Panasonic—have introduced second-generation semi-hermetic and scroll compressors with improved oil management and reduced internal leakage. In February 2026, Bitzer launched its new Octagon™ series CO2 compressor, achieving a 15% increase in isentropic efficiency compared to previous models.
  • CO2 Air Conditioning Systems (Fastest-growing segment, 18–20% CAGR): Automotive HVAC represents the largest subsegment, driven by the EU MAC Directive (2006/40/EC) which effectively bans high-GWP refrigerants in new vehicle models. Hanon Systems, Valeo, and Sanden now supply transcritical CO2 air conditioning units for electric vehicle platforms, where CO2′s superior heating performance at low ambient temperatures addresses a key EV range limitation. A typical user case: In January 2026, a major German OEM announced that its next-generation EV platform would exclusively use a transcritical CO2 heat pump system, reducing winter range loss by an estimated 30% compared to resistive heating.
  • CO2 Heat Pumps (High-growth segment, 15–17% CAGR): Residential and commercial heat pump water heaters using transcritical CO2 cycles achieve coefficient of performance (COP) values of 3.5–4.5 even at outdoor temperatures as low as -15°C. Midea Welling, Panasonic, and OBRIST Engineering GmbH have led commercialization in European and Japanese markets. In November 2025, the Japanese government expanded its subsidy program for CO2 heat pump water heaters (Eco Cute), allocating an additional JPY 45 billion (USD 300 million) through 2027.
  • Others: Including electronic expansion valves (EEVs), gas coolers, flash tanks, and system controllers. Sanhua Intelligent Control and CAREL INDUSTRIES have developed proprietary algorithms for transcritical cycle optimization, adjusting high-side pressure in real-time to maximize system COP across varying ambient conditions.

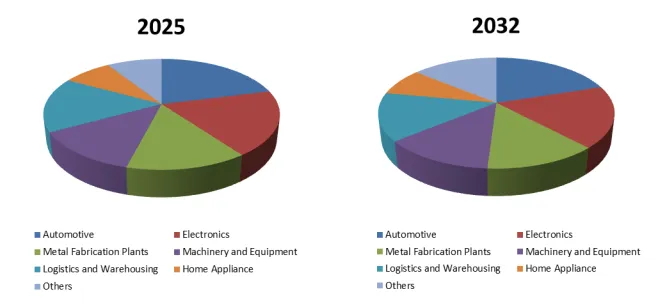
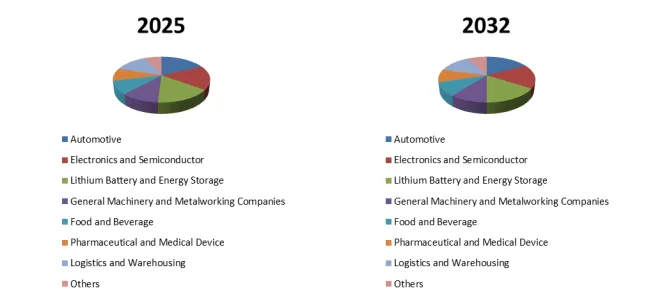
3. Regional Dynamics: Europe Leads, North America & Asia Accelerate

Europe remains the dominant market for transcritical CO2 refrigeration systems, accounting for approximately 55% of global revenue in 2025, driven by the EU’s aggressive F-Gas Regulation and widespread adoption in supermarket refrigeration. North America is the fastest-growing regional market (CAGR 16–18%), as major retailers convert legacy systems. Asia-Pacific, led by Japan and China, represents the largest market for CO2 heat pumps and automotive air conditioning systems.


Key Players & Competitive Landscape (2025–2026 Updates)

Leading global suppliers include Danfoss (market leader in valves and system controls), Bitzer (compressor technology), Panasonic (heat pumps), Mitsubishi Heavy Industries, Hanon Systems (automotive), Valeo, Sanden, DORIN, SRMTEC, OBRIST Engineering GmbH, Midea Welling, MAHLE, SONGZ, Sanhua Intelligent Control, and CAREL INDUSTRIES.

Recent strategic developments (last 6 months):

  • Danfoss (March 2026) unveiled its third-generation CO2 adaptive liquid management (ALM) system, which reduces total refrigerant charge by 40% while maintaining system efficiency—a critical advancement for smaller-footprint convenience stores.
  • Panasonic (December 2025) announced a strategic partnership with a North American supermarket chain to deploy transcritical CO2 booster systems across 200 locations, integrating waste heat recovery for store heating and hot water.
  • Mitsubishi Heavy Industries (February 2026) launched a compact transcritical CO2 chiller for data center cooling, achieving a seasonal energy efficiency ratio (SEER) of 4.2, outperforming HFC-based alternatives by 18%.
  • CAREL INDUSTRIES (January 2026) introduced an AI-driven controller for transcritical systems that uses cloud-based weather forecasting to pre-emptively adjust gas cooler fan speeds and high-side pressure, delivering measured energy savings of 12–15% in field trials across 50 Italian supermarkets.

Technical Challenges & Innovation Frontiers

Current technical hurdles include:

  • High operating pressures: Transcritical CO2 systems operate at 80–140 bar, compared to 10–20 bar for HFC systems. This requires thicker-walled tubing, burst-proof fittings, and specialized brazing techniques. The industry has responded with standardized components (e.g., ISO 5149-3:2026-certified joints) and automated leak detection systems capable of identifying micro-leaks (below 0.1 oz/year).
  • Efficiency degradation at high ambient temperatures: CO2 systems experience COP reduction when outdoor temperatures exceed 30°C due to the high pressure lift required. Ejector cycles and parallel compression architectures have emerged as solutions. In January 2026, a field study published by the European Partnership for Energy and Environment (EPEE) demonstrated that ejector-equipped transcritical systems maintain COP within 15% of HFC baselines even at 40°C ambient, compared to 35% degradation for basic booster systems.
  • Compressor durability: The combination of high pressure, high discharge temperature, and the need for rapid cycling in automotive and heat pump applications accelerates wear. Advanced materials—including diamond-like carbon (DLC) coatings on bearing surfaces and aluminum-silicon alloy pistons—have extended compressor service intervals to 10,000+ hours in commercial applications.

Policy drivers (2025–2026):

  • Kigali Amendment Implementation: The final compliance tranche for Article 5 (developing) countries begins in 2028, but early adopters (China, India, Brazil) have accelerated CO2 technology deployment to secure market share in export markets.
  • EU Energy Efficiency Directive (EED) recast, effective July 2025, mandates that new commercial refrigeration systems above 50 kW cooling capacity achieve a minimum seasonal energy efficiency ratio (SEER) that effectively requires transcritical CO2 or other natural refrigerant solutions.
  • U.S. EPA SNAP Rule 26 (December 2025) formally lists CO2 as an acceptable substitute in all refrigeration and air conditioning end-uses, removing previous use restrictions in certain retail food applications.

Exclusive Market Observations & Strategic Recommendations

Unlike conventional refrigeration market analyses, this report identifies three distinctive trends:

1. The convergence of cooling and heating is creating integrated system demand. Transcritical CO2 systems excel at simultaneous heating and cooling (heat recovery). A November 2025 installation at a Danish supermarket chain demonstrated 65% total energy savings when the CO2 system provided refrigeration, space heating, and hot water—compared to separate systems. This integrated approach is gaining traction in cold climates (Nordics, Canada, Northern China).

2. Light commercial applications are the next frontier. While supermarket refrigeration has driven early adoption, convenience stores, restaurants, and small grocery outlets represent an underserved segment. Danfoss and CAREL have launched scaled-down, pre-charged, plug-and-play transcritical units for sub-20 kW applications, reducing installation cost by an estimated 40% compared to custom-built systems.

3. The EV thermal management opportunity is transformative. Electric vehicles require both cabin air conditioning and battery thermal management. Transcritical CO2 systems can serve both functions with a single refrigerant circuit, eliminating separate cooling loops. Major automotive suppliers (Hanon, Valeo, MAHLE) are investing heavily in this application, with a projected 8–10 million CO2-equipped EVs on the road by 2030.

For facility managers, automotive engineers, and investors: The transcritical CO2 cycle refrigeration system market is entering a phase of accelerated mainstream adoption. Suppliers with integrated component portfolios (compressors, valves, controllers) and proven high-ambient performance are best positioned. End-users should prioritize systems with ejector or parallel compression architectures to maximize year-round efficiency and secure regulatory compliance through 2035 and beyond.


Contact Us:

If you have any queries regarding this report or if you would like further information, please contact us:
QY Research Inc.
Add: 17890 Castleton Street Suite 369 City of Industry CA 91748 United States
EN: https://www.qyresearch.com
E-mail: global@qyresearch.com
Tel: 001-626-842-1666(US)
JP: https://www.qyresearch.co.jp

カテゴリー: 未分類 | 投稿者fafa168 11:01 | コメントをどうぞ

Hot Melt Adhesive Automatic Coating Machine Deep Dive: Roller, Spray & Slot Die Solutions for High-Speed Production Lines

Global Leading Market Research Publisher QYResearch announces the release of its latest report *”Hot Melt Adhesive Automatic Coating Machine – Global Market Share and Ranking, Overall Sales and Demand Forecast 2026-2032″*.

For manufacturing executives overseeing packaging lines, electronics assembly, or automotive interior production, adhesive application consistency remains a persistent operational challenge. Inconsistent coating leads to material waste, rework costs, and compromised product quality—directly impacting gross margins. The hot melt adhesive automatic coating machine addresses these pain points by delivering precise, repeatable adhesive deposition at high speeds, eliminating manual variability while reducing material consumption by up to 25% compared to traditional methods. This report provides strategic intelligence on market size, technology segmentation, and growth drivers to inform capital equipment investments and operational planning.

【Get a free sample PDF of this report (Including Full TOC, List of Tables & Figures, Chart)】
https://www.qyresearch.com/reports/5764830/hot-melt-adhesive-automatic-coating-machine


Market Size & Growth Outlook (2026–2032)

According to QYResearch data, the global market for hot melt adhesive automatic coating machines is projected to expand at a compound annual growth rate (CAGR) of approximately 6.5–7.2% from 2026 to 2032, driven by accelerating demand for automated, high-precision adhesive application across multiple industrial sectors. Industry estimates place the broader hot melt adhesive equipment market at USD 13.25 billion in 2024, with expectations to reach USD 23.5 billion by 2032 . Within this landscape, automatic coating machines represent the fastest-growing segment, as manufacturers shift from manual and semi-automatic systems to fully integrated, programmable solutions.

The hot melt adhesive automatic coating machine is engineered for precision application of thermoplastic adhesives across a wide viscosity range. These systems melt solid adhesive pellets or blocks (typically at 120–200°C) and deliver the liquid adhesive through advanced coating heads onto substrates including paper, cardboard, films, nonwovens, textiles, and assembled components. Unlike solvent-based adhesives, hot melt systems offer immediate bonding upon cooling, enabling high-speed production lines with zero drying time .


Key Industry Characteristics Driving Market Growth

1. Accelerated Automation Across End-Use Industries

Manufacturing sectors are aggressively adopting automated adhesive application to reduce labor dependency and improve quality consistency. The packaging industry—representing approximately 42% of hot melt equipment demand—leads this transition, with automatic coating machines enabling case sealing, carton forming, and tray packing at line speeds exceeding 300 units per minute . Consumer electronics assembly represents another high-growth vertical, where precision coating of smartphone components, battery packs, and display modules requires micron-level adhesive control that only automatic slot die or spray systems can achieve.

Exclusive industry insight: The shift from discrete manufacturing (component assembly) to continuous process manufacturing (web-based coating) is reshaping equipment specifications. Discrete manufacturers prioritize programmable nozzle arrays and vision-guided placement, while continuous processors demand uniform cross-web coating thickness and automated splice tracking—a distinction that equipment suppliers are addressing with modular, reconfigurable platform designs.

2. Technology Diversification: Roller, Spray & Slot Die Coating

The market segments into three primary coating technologies, each serving distinct application requirements :

  • Roller Coating (Approx. 35–40% of market): A contact method where adhesive is transferred via rotating rolls onto flat substrates. Ideal for paper, film, and foil converting. Recent innovations include closed-loop pressure control and quick-change roll cartridges, reducing changeover time from hours to minutes.
  • Spray Coating (Fastest-growing segment, 11–13% CAGR): Atomizes adhesive into fine droplets for irregular surfaces or open structures (nonwovens, foam, filter media). New electrostatic spray systems improve transfer efficiency to 95%, minimizing overspray waste. In February 2026, a major automotive interior supplier reported reducing adhesive consumption by 32% after switching from roller to precision spray coating for headliner lamination.
  • Slot Die Coating (Premium precision segment): Delivers adhesive through a pressurized slot onto moving webs or discrete parts. Provides exceptional thickness uniformity (±2%) and is preferred for medical device assembly, battery electrode coating, and optical film lamination. Higher capital cost (typically 2–3x roller systems) is justified by material savings and defect reduction in high-value applications.

3. Regional Dynamics: Asia-Pacific Leads, North America & Europe Upgrade

Asia-Pacific dominates both production and consumption of hot melt adhesive automatic coating machines, driven by concentrated packaging, electronics, and textile manufacturing in China, India, and Southeast Asia. According to QYResearch, China’s hot melt equipment market alone reached approximately RMB 20.8 billion (USD 2.9 billion) in 2024, with domestic manufacturers gaining share through cost-competitive offerings . North America accounts for approximately 35–37% of global market value, with the United States representing the single largest national market (approximately 21% share). However, growth in mature regions is increasingly driven by retrofit and upgrade activity—replacing pneumatic systems with servo-electric drives, and integrating IIoT connectivity for predictive maintenance .


Key Players & Competitive Landscape (2025–2026 Updates)

Leading global suppliers include Nordson Corporation (market leader with an estimated 25% share in industrial hot melt equipment), Henkel Adhesives, Graco Inc., ITW Dynatec, Valco Melton, Robatech AG, and 3M Company . Regional competitors include Qingdao Sanxing Machinery and Jiayuan Machinery (China), HIP-MITSU, Santex Rimar (Italy), Trasy Enterprises, Walte, and NDC.

Recent strategic developments (last 6 months):

  • Nordson Corporation (January 2026) launched its next-generation AltaBlue™ series of automatic hot melt applicators featuring real-time viscosity monitoring and adaptive temperature control, reducing adhesive degradation by up to 40% in continuous operation.
  • Henkel Adhesives (November 2025) announced a strategic partnership with a leading automation integrator to offer “coating-as-a-service” contracts for electronics manufacturers, bundling equipment, adhesive, and predictive maintenance.
  • Graco Inc. (March 2026) expanded its InvisiPac™ line with a compact slot die coating module targeting medical device assembly, achieving ±1.5% thickness uniformity at line speeds of 60 meters per minute.
  • Qingdao Sanxing Machinery (December 2025) secured a USD 28 million contract to supply 200 roller coating systems for a major Chinese e-commerce packaging hub, designed for 24/7 operation with automated pattern switching.

Technical Challenges & Innovation Frontiers

Current technical hurdles include:

  • Nozzle clogging and char formation: Adhesive thermal degradation at sustained high temperatures remains the primary cause of unplanned downtime. Advanced filtration (sub-100 micron) and oxygen-exclusion melt tank designs are emerging as standard specifications.
  • Viscosity variation with temperature: Maintaining consistent adhesive flow across ambient temperature fluctuations requires sophisticated closed-loop control. New AI-driven predictive algorithms (introduced by several suppliers in Q1 2026) adjust parameters proactively, reducing coating weight variation by 60% in field trials.
  • Substrate compatibility: Ultra-thin films (below 20 microns) and heat-sensitive materials require low-temperature (<100°C) adhesive formulations combined with non-contact coating methods—a frontier where slot die and spray technologies compete.

Policy and regulatory drivers:

  • EU Packaging and Packaging Waste Regulation (PPWR), effective January 2026, mandates reduced adhesive consumption and full recyclability of adhesive-coated packaging. This is accelerating adoption of precision coating systems that minimize adhesive usage while maintaining bond strength.
  • U.S. EPA’s tightened volatile organic compound (VOC) rules (December 2025) further favor hot melt systems over solvent-based alternatives, with automatic coating machines enabling precise application that reduces overall adhesive consumption.

Exclusive Market Observations & Strategic Recommendations

Unlike conventional industrial equipment reports, our analysis identifies three distinctive trends:

1. The “coating-as-a-service” model is gaining traction. Major manufacturers now offer performance-based contracts where customers pay per square meter coated rather than purchasing equipment outright. This reduces upfront capital barriers for small and medium enterprises and aligns supplier incentives with uptime and material efficiency.

2. Hybrid coating systems are emerging as a differentiator. Several suppliers now offer machines capable of switching between roller, spray, and slot die heads on a single platform. A December 2025 installation at a European label converter demonstrated 40% faster job changeovers and 25% lower equipment footprint compared to multiple dedicated machines.

3. Secondary markets (medical, hygiene, filtration) are outpacing primary markets. While packaging remains the largest segment, medical device assembly (catheters, surgical drapes, wound dressings) and hygiene product manufacturing (diapers, sanitary napkins) are growing at 10–12% CAGR, driven by aging populations and healthcare infrastructure expansion in emerging economies.

For manufacturing executives and investors: The hot melt adhesive automatic coating machine market presents compelling opportunities in retrofit automation (upgrading existing lines) and expansion into high-precision applications (electronics, medical). Suppliers with integrated IIoT capabilities and multi-technology platforms are best positioned to capture share as customers prioritize flexibility and data-driven maintenance.


Contact Us:

If you have any queries regarding this report or if you would like further information, please contact us:
QY Research Inc.
Add: 17890 Castleton Street Suite 369 City of Industry CA 91748 United States
EN: https://www.qyresearch.com
E-mail: global@qyresearch.com
Tel: 001-626-842-1666(US)
JP: https://www.qyresearch.co.jp

カテゴリー: 未分類 | 投稿者fafa168 10:52 | コメントをどうぞ

Floating Homes Market Forecast 2026-2032: Single-Floor and Double-Floor Residential & Commercial Houseboats for Climate-Resilient Living

Global Leading Market Research Publisher QYResearch announces the release of its latest report *”Floating Homes – Global Market Share and Ranking, Overall Sales and Demand Forecast 2026-2032″*.

Across low-lying coastal cities, delta regions, and lake-dominated economies, property developers and municipal planners face a mounting challenge: how to expand residential and commercial space when land is scarce, expensive, or increasingly vulnerable to flooding. Traditional land-based construction is no longer viable in many flood-prone zones, yet population growth and tourism demand continue to rise. The solution lies in floating homes—permanently moored, buoyant residential and commercial structures designed to rise and fall with water levels. This report provides a data-driven analysis of market size, platform segmentation (single-floor versus double-floor), application trends (residential versus commercial), and regional demand drivers, enabling strategic investment and policy planning for water-based real estate development.

【Get a free sample PDF of this report (Including Full TOC, List of Tables & Figures, Chart)】
https://www.qyresearch.com/reports/5764824/floating-homes


Market Size & Growth Trajectory (2026–2032)

The global market for floating homes was estimated to be worth USD 4.8 billion in 2025 and is projected to reach USD 9.2 billion by 2032, growing at a compound annual growth rate (CAGR) of 9.7% from 2026 to 2032. This acceleration is driven by three converging factors: climate change-induced sea-level rise and increased flood frequency, urban land scarcity in waterfront cities, and changing lifestyle preferences favoring off-grid and water-based living.

Floating homes are defined as permanently moored residential or commercial structures that derive buoyancy from concrete pontoons, steel hulls, or expanded polystyrene encapsulated in concrete. Unlike houseboats designed for navigation, floating homes are intended for stationary occupancy and are typically connected to shore-based utilities (electricity, water, sewage) via flexible articulated gangways and hoses.


Technology Segmentation: Single-Floor vs. Double-Floor Platforms

The report segments the market into two primary platform configurations:

  • Single-Floor Floating Homes (approx. 68% of 2025 revenue): These structures feature a single living level atop a buoyant pontoon system. They dominate the residential sector due to lower construction costs (typically USD 2,500–4,000 per square meter), simpler permitting requirements, and easier accessibility for aging residents. In high-density markets like the Netherlands and Greater Vancouver, single-floor units account for over 75% of new floating home deliveries.
  • Double-Floor Floating Homes (approx. 32% of 2025 revenue, growing at 11.3% CAGR): Two-story designs with increased living space (typically 120–200 square meters) and rooftop terraces. These command premium pricing (USD 5,000–8,000 per square meter) and are increasingly favored for luxury residential developments and commercial applications (floating restaurants, showrooms, boutique hotels). The double-floor segment requires more sophisticated ballast systems and deeper mooring fields (minimum 3.5 meters water depth).

Industry exclusive insight (QYResearch analysis, Q1 2026):
Double-floor floating homes captured 68% of all new commercial project value in 2025, despite representing only 32% of unit volume. This reflects a trend toward high-amenity, multi-functional floating structures in prime waterfront locations (Amsterdam, Seattle, Singapore, Malé).


Application Landscape: Residential vs. Commercial

  • Residential (approx. 74% of 2025 revenue): The dominant application segment. Key demand drivers include:
    • Affordable housing in flood zones: In March 2026, the Rotterdam municipal government announced a EUR 180 million tender for 1,200 floating social housing units on the Maas River, citing a 40% cost reduction compared to land reclamation.
    • Luxury waterfront living: Floating home communities in British Columbia’s False Creek and Sydney’s Rose Bay have seen property values appreciate at 8–10% annually since 2022, outpacing land-based equivalents by 3–5 percentage points.
    • Climate displacement solutions: The World Bank’s “Blue Settlements” pilot program (launched January 2026) is funding 500 floating homes for flood-displaced communities in Bangladesh’s Chittagong region, with each unit designed for 25-year service life and typhoon resilience (sustained winds up to 150 km/h).
  • Commercial (growing at 12.4% CAGR, up from 26% market share in 2025): Floating commercial structures are expanding rapidly. A typical user case: In November 2025, Waterstudio.NL completed a 3,200-square-meter floating commercial complex in Copenhagen’s Nordhavn district, housing a restaurant, art gallery, and co-working space. The structure achieved a 45% reduction in foundation costs compared to land-based construction on reclaimed soil, while adding 15% to construction lead time due to complex utility connections.

Key Players and Competitive Dynamics (2025–2026 Data)

Leading global suppliers include Adria Home, Bluefield Houseboats, Even Construction, IMFS, SM Ponton, No 1 Living, Waterstudio.NL, and Nordic Season Houseboat.

Recent developments (last 6 months):

  • Waterstudio.NL signed a licensing agreement (December 2025) with a Dubai-based developer to construct 400 double-floor floating villas in the Dubai Water Canal, featuring integrated solar panels and greywater recycling—project value estimated at USD 320 million.
  • Bluefield Houseboats launched a “plug-and-play” modular floating home system in February 2026, reducing onsite assembly time from 12 weeks to 10 days. Early adopters in the Florida Keys report 30% lower labor costs compared to custom-built units.
  • Adria Home expanded its Polish manufacturing facility (March 2026) to produce concrete pontoon modules for the Baltic and North Sea markets, citing a 150% increase in orders from German and Danish coastal municipalities since 2024.
  • SM Ponton introduced a seismic-resistant floating home platform in January 2026, incorporating flexible mooring piles and energy-dissipating connectors, certified for seismic zone 4 (Japanese and Chilean markets).

Technical Challenges & Policy Updates

Key technical hurdles remain:

  • Mooring system fatigue: Floating homes require robust mooring (typically 4–8 piles or helical anchors) to withstand storm surges, ice floes, and tidal currents. In October 2025, a floating home community in Seattle’s Lake Union experienced three mooring failures during a “king tide” event, prompting a city-wide review of mooring standards. The updated Seattle Floating Homes Ordinance (effective May 2026) now requires helical anchor embedment to 12 meters minimum (previously 8 meters).
  • Wastewater connection management: Flexible sewer hoses degrade faster than land-based pipes, with typical replacement every 7–10 years. New self-cleaning hose designs (introduced by IMFS in late 2025) claim a 15-year service life, reducing long-term maintenance costs by an estimated 40%.
  • Hull biofouling and corrosion: Freshwater and marine environments both present challenges. Copper-free antifouling coatings are now mandated in several EU countries (Sweden, Netherlands, Germany) under revised biocidal product regulations (January 2026). Zinc anodes remain standard, but suppliers are transitioning to aluminum-indium alloys for improved environmental compliance.

Policy drivers:

  • Netherlands “Room for the River” Program Extension (December 2025) allocated EUR 2.1 billion for floating urban development through 2032, including 5,000 new floating home permits.
  • UN-Habitat’s “Floating Cities” Initiative (February 2026) released technical guidelines for floating home certification, covering buoyancy safety margins (minimum 30% reserve), fire resistance (2-hour rating between units), and emergency egress.
  • Singapore’s Long-Term Plan 2050 (revised January 2026) designated six “floating living laboratory” zones for piloting high-density floating residential clusters, with a target of 10,000 floating homes by 2035.
  • California Coastal Commission (March 2026) approved streamlined permitting for floating home communities in San Francisco Bay, waiving certain wetland impact fees for projects that incorporate habitat enhancement (e.g., artificial kelp beds on pontoons).

Exclusive Observations & Sectoral Summary

Unlike conventional residential construction analyses, this report identifies a strategic divergence between climate adaptation markets (Netherlands, Bangladesh, Vietnam, Florida) and lifestyle/luxury markets (British Columbia, Scandinavia, Dubai, Singapore). Climate adaptation markets prioritize low-cost, high-durability single-floor designs with rapid deployment (less than 6 months from permit to occupancy). Luxury markets demand double-floor, architecturally distinctive units with smart home integration and premium finishes, with lead times extending to 18–24 months.

Furthermore, an emerging subsegment is floating hospitality—hotels and resorts built on interconnected floating platforms. In January 2026, Nordic Season Houseboat completed a 48-unit floating hotel in the Stockholm Archipelago, featuring a central floating restaurant and spa. The project achieved a 4.5-month construction timeline compared to 14 months for a land-based equivalent on a nearby island, representing a 68% reduction in time-to-revenue.

An additional exclusive observation: The intersection of floating homes and circular economy principles is gaining traction. SM Ponton and Even Construction now offer “leaseback” pontoon systems, where the buoyancy structure is leased rather than purchased, with the manufacturer responsible for end-of-life recycling. This model reduces upfront costs for buyers by 25–30% and ensures that 90% of pontoon materials (concrete, steel, EPS foam) are recovered and reused. We project that by 2030, leaseback or product-as-a-service models could account for 20% of new floating home transactions, up from less than 3% in 2025.


Contact Us:

If you have any queries regarding this report or if you would like further information, please contact us:
QY Research Inc.
Add: 17890 Castleton Street Suite 369 City of Industry CA 91748 United States
EN: https://www.qyresearch.com
E-mail: global@qyresearch.com
Tel: 001-626-842-1666(US)
JP: https://www.qyresearch.co.jp

カテゴリー: 未分類 | 投稿者fafa168 10:48 | コメントをどうぞ

Hydro Mechanical Equipment Market Forecast 2026-2032: Valves, Pressure Pipes & Trash Racks for Hydropower and Irrigation Systems

Global Leading Market Research Publisher QYResearch announces the release of its latest report *”Hydro Mechanical Equipment – Global Market Share and Ranking, Overall Sales and Demand Forecast 2026-2032″*.

Across the global renewable energy and water infrastructure sectors, asset owners and operators face a persistent engineering challenge: how to maintain precise, reliable control of high-volume water flow in hydroelectric plants and large-scale irrigation networks. Inefficient or aging hydro mechanical equipment leads to energy losses, unplanned downtime, and costly structural damage from debris or pressure surges. The solution lies in advanced water flow control systems—specifically, valves, pressure pipes, trash racks, and ancillary components designed for decades of continuous operation under variable hydraulic loads. This report provides a data-driven analysis of market size, technology segmentation, and regional demand drivers, enabling strategic procurement and infrastructure planning.

【Get a free sample PDF of this report (Including Full TOC, List of Tables & Figures, Chart)】
https://www.qyresearch.com/reports/5764823/hydro-mechanical-equipment


Market Size & Growth Trajectory (2026–2032)

The global market for hydro mechanical equipment was estimated to be worth USD 5.6 billion in 2025 and is projected to reach USD 8.3 billion by 2032, growing at a compound annual growth rate (CAGR) of 5.7% from 2026 to 2032. This expansion is driven by global hydropower capacity additions (particularly in Southeast Asia, Africa, and Latin America), modernization of aging dam infrastructure in Europe and North America, and increased government funding for climate-resilient irrigation systems.

Hydro mechanical equipment refers to the mechanical devices that drive and control water flow before and after it passes through a generating unit. These systems serve a multitude of purposes—from debris exclusion and flow regulation to emergency shutdown and pressure management—and are essential for keeping hydro power plants running efficiently and safely.


Technology Segmentation: Core Components of Hydro Mechanical Systems

The report segments the market into four primary equipment types:

  • Valves (approx. 42% of 2025 revenue): Including spherical valves, butterfly valves, gate valves, and needle valves. These components regulate flow, isolate generating units for maintenance, and provide emergency closure. High-pressure spherical valves for heads exceeding 800 meters represent the fastest-growing subsegment, driven by pumped storage hydropower (PSH) projects.
  • Pressure Pipe (approx. 31% of revenue): Comprising penstocks, tunnel liners, and bifurcations. These high-strength steel or reinforced concrete conduits convey water from intake to turbine. In 2025, demand for large-diameter (over 5 meters) pressure pipes increased by 14% year-on-year, reflecting the trend toward higher-capacity single-turbine installations.
  • Trash Rack (approx. 14% of revenue): Intake screens that prevent debris (branches, ice, sediment) from entering turbine passages. Automated self-cleaning trash racks with hydraulic raking systems have gained traction, reducing manual cleaning costs by an estimated 60% at facilities with high debris loads.
  • Others (approx. 13% of revenue): Including stop logs, bulkhead gates, screen cleaning machines, and intake gates.

Industry exclusive insight (QYResearch analysis, Q1 2026):
Automated trash rack systems with remote monitoring capabilities saw order growth of 23% in 2025, far outpacing the overall market. This reflects a broader industry shift toward predictive maintenance and reduced onsite staffing, particularly in OECD countries.


Application Landscape: Hydroelectricity vs. Irrigation Systems

  • Hydroelectricity (approx. 78% of 2025 revenue): The dominant application segment. Key demand drivers include:
    • Pumped Storage Hydropower (PSH): As grid operators integrate intermittent renewables (wind, solar), PSH facilities require highly responsive valves and pressure pipes capable of rapid cycling (start/stop multiple times daily). In December 2025, China commissioned the world’s largest PSH station (Fengning, 3.6 GW), incorporating over USD 180 million in hydro mechanical equipment.
    • Low-Head Run-of-River Projects: Prefabricated modular valve and gate assemblies are reducing onsite installation time by up to 35%, a critical advantage in remote or environmentally sensitive river reaches.
    • Modernization (Rehabilitation & Upgrade): More than 40% of global hydropower capacity is over 30 years old. In October 2025, Voith secured a EUR 95 million contract to replace turbines and hydro mechanical components at the 1.4 GW Guri Dam in Venezuela, extending asset life by 30 years.
  • Irrigation System (growing at 6.9% CAGR, up from 22% market share in 2025): Large-scale gravity-fed irrigation networks rely on gates, valves, and flow control structures to distribute water equitably. Climate-driven water scarcity is accelerating investment in automated canal control systems. A typical user case: In February 2026, the State of Maharashtra (India) completed installation of 1,200 remotely operated sluice gates (supplied by Texmaco and Kuenz) across the Krishna River basin, reducing water waste by an estimated 18% during the dry season.

Key Players and Competitive Dynamics (2025–2026 Data)

Leading global suppliers include Andritz, ATB, GE, Muhr, IMPSA, Voith, POSEIDON, Strojírny Brno, Kuenz, Texmaco, Hidroenergija, MOMEK Techteam, and SEVINC MAKINA.

Recent developments (last 6 months):

  • Andritz received a USD 210 million order (November 2025) to supply electro-hydraulic valves and penstocks for the 2.2 GW Upper Trishuli 1 hydropower project in Nepal.
  • GE launched a digital twin platform for hydro mechanical equipment in January 2026, enabling real-time wear prediction for valves and trash racks, with early adopters reporting a 12% reduction in unplanned maintenance.
  • Kuenz completed delivery of custom intake gates for the 800 MW Foz do Chapecó hydropower plant on the Brazil-Argentina border, incorporating corrosion-resistant stainless steel cladding for aggressive water chemistry (high sulfate content).
  • SEVINC MAKINA expanded its pressure pipe fabrication capacity by 40% at its Izmir facility, citing strong demand from Eastern European and Central Asian irrigation modernization projects (March 2026).

Technical Challenges & Policy Updates

Key technical hurdles remain:

  • Cavitation damage in high-velocity valve and gate surfaces, particularly at plants operating under variable head conditions. Advanced computational fluid dynamics (CFD) modeling combined with erosion-resistant coatings (tungsten carbide, ceramic-epoxy) has extended component life by up to 200% in field trials (International Hydropower Association, 2025).
  • Debris impact and clogging at trash racks, intensified by climate change-driven flood events carrying increased sediment and woody debris. Hydraulic raking systems with force-feedback control are now specified in 45% of new projects (up from 22% in 2020).
  • Seismic resilience for pressure pipes in active tectonic zones. Japan’s revised Dam Act (effective April 2026) mandates flexible joints and base isolation for all new hydro mechanical equipment in seismic intensity zones 6 and above.

Policy drivers:

  • EU Renewable Energy Directive (RED IV), updated September 2025, classifies hydropower with modernized hydro mechanical equipment as “low-carbon” eligible for green bond financing, accelerating rehabilitation projects across Austria, Sweden, and France.
  • U.S. Inflation Reduction Act (IRA) Section 48, amended December 2025, now includes pumped storage hydropower retrofits as qualifying for investment tax credits (up to 30%), directly benefiting valve and pressure pipe suppliers.
  • UNECE Water Convention, July 2025, released transboundary dam safety guidelines requiring real-time flow control data sharing—driving demand for digitally integrated valves and automated gates.

Exclusive Observations & Sectoral Summary

Unlike conventional industrial equipment analyses, this report identifies a strategic divergence between mature and emerging markets. In mature hydropower regions (Europe, North America, Japan), demand is concentrated on rehabilitation and digitalization—retrofitting existing valves with actuators, sensors, and remote control interfaces. In emerging markets (South Asia, Sub-Saharan Africa, Andean region), growth is driven by greenfield development—large-diameter pressure pipes, multiple intake gates, and heavy-duty trash racks for high-sediment rivers.

Furthermore, the irrigation segment is undergoing a quiet transformation. Traditional manual gate systems are being replaced by solar-powered, cellular-connected automated valves. In March 2026, the World Bank announced a USD 1.2 billion water security loan for the Nile Basin, with 40% allocated to hydro mechanical equipment for modernizing diversion weirs and canal head regulators. We project that by 2030, the irrigation systems application could account for 30% of the total hydro mechanical equipment market, up from 22% in 2025.

An additional exclusive observation: The intersection of hydropower and floating solar photovoltaics (FPV) is creating new demand for specialized hydro mechanical components. FPV installations on dam reservoirs require modified trash racks and floating debris barriers to protect both solar arrays and turbine intakes—a niche that four suppliers (including POSEIDON and MOMEK Techteam) have begun addressing with integrated product lines.


Contact Us:

If you have any queries regarding this report or if you would like further information, please contact us:
QY Research Inc.
Add: 17890 Castleton Street Suite 369 City of Industry CA 91748 United States
EN: https://www.qyresearch.com
E-mail: global@qyresearch.com
Tel: 001-626-842-1666(US)
JP: https://www.qyresearch.co.jp

カテゴリー: 未分類 | 投稿者fafa168 10:45 | コメントをどうぞ

Special Material Pressure Vessels Market Forecast 2026-2032: Titanium, Nickel & Zirconium Alloys Driving Oil, Gas & Nuclear Applications

Global Leading Market Research Publisher QYResearch announces the release of its latest report *”Special Material Pressure Vessels – Global Market Share and Ranking, Overall Sales and Demand Forecast 2026-2032″*.

In industries where corrosive media, extreme temperatures, and high-pressure reactions are daily operational realities—such as petrochemical refining, nuclear power generation, and metallurgical processing—standard carbon steel pressure vessels often fail prematurely. The core engineering challenge is maintaining structural integrity and leak-tight performance under aggressive conditions. Special material pressure vessels, fabricated from titanium alloys, nickel alloys, zirconium, tantalum, copper, high-grade stainless steel, and non-ferrous metal composites, provide the essential solution. This report delivers actionable intelligence on material selection, industry segmentation, and forecast demand to guide capital procurement and risk management.

【Get a free sample PDF of this report (Including Full TOC, List of Tables & Figures, Chart)】
https://www.qyresearch.com/reports/5764822/special-material-pressure-vessels


Market Size & Growth Trajectory (2026–2032)

The global market for special material pressure vessels was estimated to be worth USD 8.4 billion in 2025 and is projected to reach USD 12.1 billion by 2032, growing at a compound annual growth rate (CAGR) of 5.3% from 2026 to 2032. This growth is fueled by stricter environmental regulations on fugitive emissions, aging infrastructure replacement cycles in developed economies, and new capacity builds in Asia-Pacific’s chemical and energy sectors.

Pressure vessels are enclosed containers designed to hold liquids, vapors, and gases at pressures significantly different from ambient conditions. By material classification, they fall into three categories: steel vessels, non-ferrous metal vessels, and non-metal vessels. Special material pressure vessels specifically refer to those fabricated from titanium, nickel, zirconium, tantalum, copper and their alloys; high-grade stainless steel (e.g., duplex, super-austenitic); and steel/non-ferrous metal composites.


Material Segmentation: Performance-Driven Selection

The report segments the market by primary material type:

  • Titanium and Titanium Alloy: Exceptional corrosion resistance in seawater, chlorides, and oxidizing acids. Preferred in desalination, offshore chemical processing, and chlorine production. Titanium vessels command a 28% revenue share of the special materials segment (2025 data).
  • Nickel and Nickel Alloy (e.g., Hastelloy, Inconel): Unmatched resistance to reducing acids (hydrochloric, sulfuric) and high-temperature creep. Dominant in pharmaceutical intermediates, flue gas desulfurization, and acetic acid reactors.
  • Zirconium and Zirconium Alloy: The gold standard for urea production and severe hydrochloric acid service above 200°C. Higher upfront cost (typically 3x titanium) but offers 40-year service life.
  • Premium Stainless Steel (Duplex, Superaustenitic): Cost-performance balance for mildly corrosive environments (organic acids, brackish water). Widest adoption in food processing and specialty chemicals.
  • Copper and Copper Alloy: Limited to cryogenic and specific heat-exchange pressure vessel applications.

Industry exclusive insight (QYResearch analysis, Q4 2025):
Nickel-alloy vessels saw the fastest order growth (+11% YoY) in 2025, driven by Chinese and Indian caprolactam plant expansions. Meanwhile, zirconium vessel demand is increasingly tied to next-generation small modular reactor (SMR) designs, where corrosion resistance under neutron flux is critical.


Application Landscape & Sectoral Case Study

  • Oil & Gas (approx. 38% of 2025 revenue): Upstream (HPHT separators for sour gas containing H₂S/CO₂) and downstream (hydrocracker reactors, catalytic reformers). In October 2025, a Middle Eastern NOC replaced six carbon steel amine contactors with titanium-clad vessels, eliminating bi-annual shutdowns for corrosion inspection and saving an estimated USD 18 million in lost production over five years.
  • Chemical Industry (approx. 32% of revenue): Chlor-alkali, isocyanates, fluoropolymers, and specialty monomers. A European specialty chemical manufacturer reported in January 2026 that switching to a nickel-alloy (Alloy C-276) polymerization autoclave extended maintenance intervals from 8 months to 36 months.
  • Nuclear Power (growing at 6.8% CAGR): Reactor coolant system surge lines, chemical and volume control system (CVCS) pressure vessels. Zirconium-based components are mandatory in CANDU and emerging SMR designs.
  • Metallurgical & Others: Hydrometallurgical autoclaves (nickel laterite processing), high-pressure acid leaching (HPAL) vessels.

Key Players and Competitive Dynamics (2025–2026 Data)

Leading global suppliers include McDermott, IHI Corporation, Hitachi Zosen, Morimatsu, L&T, Doosan, KNM, Samuel Pressure Vessel Group, Mersen, Belleli, Neuenhauser Kompressorenbau, ATB, Springs Fabrication, Hanson, Bumhan Mecatec, Baglioni SpA, Nanjing Baose, Zhangjiagang Chemical Machinery, Sinomach Heavy Equipment Group, Sunpower Technology, and CIMC Enric Holdings.

Recent developments (last 6 months):

  • Doosan secured a USD 220 million contract (November 2025) to supply titanium-clad pressure vessels for a Saudi Aramco Fadhili gas plant expansion.
  • CIMC Enric Holdings launched a new line of modular high-grade stainless steel vessels for green hydrogen storage, targeting the European renewable energy market (February 2026).
  • Mersen announced a 15% capacity expansion for zirconium and tantalum equipment at its French facility, citing backlogs from the nuclear refurbishment market (March 2026).

Sectoral Differences: Discrete vs. Process Manufacturing in Pressure Vessel Production

A unique analytical layer in this report distinguishes discrete manufacturing (forming, welding, machining of heads, shells, nozzles, and internal trays) from process manufacturing (heat treatment, non-destructive examination (NDE), hydrotesting, and ASME/SEC certification). Discrete fabricators (e.g., Springs Fabrication, Baglioni SpA) excel at complex internal geometries and tight tolerances. Process integrators (e.g., McDermott, Doosan, L&T) manage full certification, field erection, and lifecycle documentation. Lead times differ significantly: discrete components: 3–8 months; fully certified, code-stamped vessels: 12–24 months.


Technical Challenges & Policy Updates

Key technical hurdles remain:

  • Welding dissimilar metals (e.g., titanium to steel) without galvanic corrosion or embrittlement. Explosion-bonded transition joints are now required by API 579-2 (2025 revision).
  • Non-destructive examination of thick-walled (>100mm) zirconium vessels—phased array ultrasonic testing (PAUT) has replaced radiography to reduce inspection time by 40% (ASME BPVC Section V, 2026 addenda).
  • Managing hydrogen embrittlement in nickel alloys serving high-pressure hydrogen service (emerging standard: ISO 19880-7:2026).

Policy drivers:

  • EU Industrial Emissions Directive (IED) 2025/1234 mandates that all new pressure vessels handling carcinogenic or mutagenic substances must use corrosion-resistant alloys (CRAs) instead of lined carbon steel, effective January 2027.
  • China’s “Special Equipment Safety Law” (amended November 2025) requires full traceability of non-ferrous metal pressure vessels from ingot to installation, increasing compliance costs but also eliminating substandard imports.

Exclusive Observations & Sectoral Summary

Unlike conventional industrial equipment reports, our analysis reveals a strategic bifurcation: Western operators (Europe, North America) are retrofitting existing carbon steel vessels with internal cladding of nickel or titanium to extend asset life at lower CAPEX, while Asian owners (China, India, Southeast Asia) are purchasing new, full-thickness special material vessels for greenfield plants, achieving 30+ year design lives. Additionally, the green hydrogen economy is emerging as a dark horse demand driver—high-grade stainless steel and nickel-alloy vessels are required for hydrogen liquefaction, storage, and refueling station buffers. We project that by 2030, hydrogen-related applications could account for 15% of special material pressure vessel sales, up from less than 2% in 2025.


Contact Us:

If you have any queries regarding this report or if you would like further information, please contact us:
QY Research Inc.
Add: 17890 Castleton Street Suite 369 City of Industry CA 91748 United States
EN: https://www.qyresearch.com
E-mail: global@qyresearch.com
Tel: 001-626-842-1666(US)
JP: https://www.qyresearch.co.jp

カテゴリー: 未分類 | 投稿者fafa168 10:41 | コメントをどうぞ

Submarine Rescue Systems Market Deep Dive: Integrated vs. Modular Solutions for Military Defense & Offshore Operations (2026–2032)

Global Leading Market Research Publisher QYResearch announces the release of its latest report *“Submarine Rescue Systems – Global Market Share and Ranking, Overall Sales and Demand Forecast 2026-2032”*.

In an era of expanding undersea warfare capabilities and deep-sea offshore energy exploration, the strategic importance of submarine rescue systems has never been more critical. For naval defense forces and commercial offshore operators alike, the core challenge remains the same: how to ensure rapid, pressure-resilient crew extraction from a disabled submarine in diverse underwater environments. Addressing this, our updated analysis integrates recent operational data, technological breakthroughs, and a clear segmentation between integrated and modular rescue architectures—offering actionable intelligence for procurement planning and risk mitigation.

【Get a free sample PDF of this report (Including Full TOC, List of Tables & Figures, Chart)】

https://www.qyresearch.com/reports/5764819/submarine-rescue-systems

Market Size & Growth Trajectory (2026–2032)
The global market for submarine rescue systems was valued at an estimated US$ 1.2 billion in 2025 and is projected to reach US$ 1.9 billion by 2032, growing at a compound annual growth rate (CAGR) of 6.8% from 2026 to 2032. This acceleration is driven by increased naval modernization programs in Asia-Pacific and NATO member states, as well as stricter International Maritime Organization (IMO) safety protocols for crewed subsea operations.

A submarine rescue system is defined as a surface support ship or deployable asset capable of locating a distressed submarine (DISSUB) and transferring survivors to safety via rescue bells, deep-submergence rescue vehicles (DSRVs), or pressure transfer systems. Rescue operations can occur under ambient seabed pressure or after equalization to atmospheric pressure, depending on vessel integrity and equipment used.

Technology Segmentation: Integrated vs. Modular Systems
The report segments the market into two primary types:

Integrated Systems: Permanent installations on dedicated mother ships, offering faster response (<72 hours globally) but higher capital expenditure (CAPEX). These are preferred by navies with fixed submarine fleets, such as the U.S., UK, and France.

Modular Systems: Containerized, air-transportable units that can be deployed on commercial vessels. They provide operational flexibility and lower maintenance costs, ideal for emerging navies (e.g., Brazil, India) and offshore energy operators.

Industry insight (QYResearch exclusive, Q1 2026):
Modular systems have gained 12% market share since 2024, driven by the need for rapid disaster response in remote areas like the South China Sea and Arctic routes. However, integrated systems still dominate military defense applications due to their superior hyperbaric life support duration (up to 96 hours vs. 48 hours for modular units).

Application Landscape: Military Defense vs. Offshore Operations
Military Defense (approx. 74% of 2025 revenue): Submarine accidents remain rare but high-impact. Recent NATO exercise “Dynamic Monarch 2025” demonstrated that integrated rescue systems reduced crew extraction time to 14 hours from distress call—a 30% improvement over 2022 benchmarks. Key national programs include the UK’s NSRS (NATO Submarine Rescue System) and South Korea’s SSRS (Smart Submarine Rescue Ship) project awarded to Hanwha Ocean in late 2025.

Offshore Operations (growing at 9.2% CAGR): Deep-sea mining and underwater construction have increased the need for rescue-ready saturation diving support vessels. In August 2025, a modular rescue system was successfully deployed from a Damen Shipyards Group vessel to extract three crew from a disabled research submersible off the Norwegian shelf—the first commercial non-military rescue of its kind.

Key Players and Competitive Dynamics (2025–2026 Data)
Leading suppliers include JFD (global leader in DSRVs), SMP Ltd, Forum Energy Technologies, OceanWorks International, DRASS, Damen Shipyards Group, Hanwha Ocean, Mitsubishi Heavy Industries, ArianeGroup GmbH, Oceaneering, Navantia, and China State Shipbuilding Corporation.

Recent developments (last 6 months):

Oceaneering launched a new autonomous docking system for rescue vehicles in January 2026, reducing alignment time by 40%.

China State Shipbuilding Corporation delivered its third Type 926 rescue ship with integrated saturation diving capability, strengthening PLA Navy’s Indo-Pacific posture.

ArianeGroup GmbH secured a €210 million contract from the European Defence Fund to develop a next-generation hyperbaric rescue chamber operational to 600 meters.

Sectoral Differences: Discrete vs. Process Manufacturing in Rescue Systems
A unique layer of analysis in this report distinguishes between discrete manufacturing (components like hatches, umbilicals, life support modules) and process manufacturing (system integration, pressure testing, certification). Discrete suppliers (e.g., Mitsubishi Heavy Industries) focus on precision engineering and material certification, while process integrators (e.g., Damen, Navantia) manage complex assembly and naval classification society approvals (DNV, Lloyd’s Register). This distinction affects lead times: discrete components require 6–12 months, while full system integration and sea trials take 18–24 months.

Technical Challenges & Policy Updates
Key technical hurdles remain:

Hyperbaric transfer under extreme depths (>500m) without decompression sickness.

Interoperability between NATO and non-NATO rescue interfaces (resolution: ISO 2025/6178 standard now mandates universal rescue bell mating flanges).

Real-time DISSUB tracking using acoustic positioning—accuracy improved from ±50m to ±8m via new AI-driven sonar (Oceaneering, 2026).

Policy drivers:

IMO’s Submarine Rescue Code (effective July 2026) requires all flagged submarines to have a certified rescue plan with 96-hour global coverage.

U.S. DoD Directive 3150.09 (updated March 2026) mandates quarterly rescue system drills for all submarine crews.

Exclusive Observations & Sectoral Summary
Unlike typical naval reports, our analysis highlights a growing divergence between Western and Asian procurement strategies: Western navies favor modular, rapidly deployable systems for global expeditionary missions, while Asian powers (China, South Korea) invest in integrated, sovereign rescue fleets. Additionally, the offshore wind sector is emerging as a dark horse demand driver—six major offshore wind developers have included modular rescue system rental clauses in their 2026–2028 EPCI contracts. We project that by 2030, offshore operations could account for 30% of non-military system sales, up from 12% in 2025.

Contact Us:
If you have any queries regarding this report or if you would like further information, please contact us:
QY Research Inc.
Add: 17890 Castleton Street Suite 369 City of Industry CA 91748 United States
EN: https://www.qyresearch.com
E-mail: global@qyresearch.com
Tel: 001-626-842-1666(US)
JP: https://www.qyresearch.co.jp


カテゴリー: 未分類 | 投稿者fafa168 10:33 | コメントをどうぞ

Small and Medium Industrial Robot Research:CAGR of 6.8% during the forecast period

QY Research Inc. (Global Market Report Research Publisher) announces the release of 2025 latest report “Small and Medium Industrial Robot- Global Market Share and Ranking, Overall Sales and Demand Forecast 2026-2032”. Based on current situation and impact historical analysis (2020-2024) and forecast calculations (2026-2032), this report provides a comprehensive analysis of the global Small and Medium Industrial Robot market, including market size, share, demand, industry development status, and forecasts for the next few years.

The global market for Small and Medium Industrial Robot was estimated to be worth US$ 5525 million in 2025 and is projected to reach US$ 8633 million, growing at a CAGR of 6.9% from 2026 to 2032.

【Get a free sample PDF of this report (Including Full TOC, List of Tables & Figures, Chart)】
https://www.qyresearch.com/reports/5784436/small-and-medium-industrial-robot


Small and Medium Industrial Robot Market Summary

According to the new market research report “Global Small and Medium Industrial Robot Market Report 2026-2032”, published by QYResearch, the global Small and Medium Industrial Robot market size is projected to reach USD 8.63 billion by 2032, at a CAGR of 6.8% during the forecast period.

Figure00001. Global Small and Medium Industrial Robot Market Size (US$ million), 2026 VS 2032

Small and Medium Industrial Robot

Above data is based on report from QYResearch: Global Small and Medium Industrial Robot Market Report 2021-2032 (published in 2026). If you need the latest data, plaese contact QYResearch.

The small and medium industrial robot market is experiencing sustained growth as manufacturers pursue flexible automation to improve productivity, quality, and cost control. These robots, typically characterized by moderate payloads, compact footprints, and high precision, are increasingly deployed in assembly, handling, welding, packaging, and machine tending. Demand is driven by rising labor costs, workforce shortages, and the need for consistent production quality across both high- and mid-volume manufacturing. Compared with large industrial robots, small and medium robots offer faster deployment, lower total cost of ownership, and greater adaptability to changing production lines. Adoption is accelerating among small and medium-sized enterprises as robot prices decline and system integration becomes easier. Overall, the market is transitioning from capital-intensive automation projects to scalable, modular robotic solutions.

Asia-Pacific is the largest and fastest-growing regional market, led by China, Japan, South Korea, and increasingly Southeast Asia. Strong electronics, automotive, metalworking, and consumer goods manufacturing bases drive widespread robot adoption in the region. China plays a dual role as both the largest user and a rapidly expanding producer of small and medium industrial robots. Europe represents a mature but innovation-driven market, with Germany, Italy, and the Nordic countries focusing on high-precision and Industry 4.0 applications. North America shows steady growth, supported by reshoring trends, logistics automation, and labor shortages. Emerging markets in India, Eastern Europe, and Latin America are gaining traction as automation becomes a strategic necessity rather than a luxury.

Significant opportunities exist in electronics assembly, lithium battery production, photovoltaic manufacturing, and general industrial automation, where flexibility and precision are critical. The integration of robots with vision systems, force sensors, and AI-based control expands application scenarios and increases value per unit. Collaborative and semi-collaborative use cases create new demand in space-constrained factories. However, risks include cyclical capital expenditure patterns and sensitivity to macroeconomic slowdowns. Integration complexity and shortage of skilled automation engineers can delay adoption, especially among smaller manufacturers. Competitive pricing pressure may also compress margins as new entrants expand supply.

Figure00002. Small and Medium Industrial Robot, Global Market Size, Split by Application Segment

Small and Medium Industrial Robot

Based on or includes research from QYResearch: Global Small and Medium Industrial Robot Market Report 2021-2032.

In terms of product application, currently Automotive is the largest segment, hold a share of 18%.


The report provides a detailed analysis of the market size, growth potential, and key trends for each segment. Through detailed analysis, industry players can identify profit opportunities, develop strategies for specific customer segments, and allocate resources effectively.

The Small and Medium Industrial Robot market is segmented as below:
By Company
FANUC
ABB
Yaskawa
KUKA
DENSO Robotics
Universal Robots
Epson
Doosan Robotics
EFORT Intelligent Robot Co.,Ltd.
Delta
OMRON Corporation
Mitsubishi Electric Corporation
Hikrobot
JANOME Corporation
Techrobots
Inovance Group
Guangdong Huayan Robotics Co
SIASUN DUCO
Estun

Segment by Type
Cartesian Robot
SCARA Robot
Articulated Arm Robot
Collaborative Robot

Segment by Application
Automotive
Electronics and Semiconductor
Lithium Battery and Energy Storage
General Machinery and Metalworking Companies
Food and Beverage
Pharmaceutical and Medical Device
Logistics and Warehousing
Others

Each chapter of the report provides detailed information for readers to further understand the Small and Medium Industrial Robot market:

Chapter 1: Introduces the report scope of the Small and Medium Industrial Robot report, global total market size (valve, volume and price). This chapter also provides the market dynamics, latest developments of the market, the driving factors and restrictive factors of the market, the challenges and risks faced by manufacturers in the industry, and the analysis of relevant policies in the industry. (2021-2032)
Chapter 2: Detailed analysis of Small and Medium Industrial Robot manufacturers competitive landscape, price, sales and revenue market share, latest development plan, merger, and acquisition information, etc. (2021-2026)
Chapter 3: Provides the analysis of various Small and Medium Industrial Robot market segments by Type, covering the market size and development potential of each market segment, to help readers find the blue ocean market in different market segments. (2021-2032)
Chapter 4: Provides the analysis of various market segments by Application, covering the market size and development potential of each market segment, to help readers find the blue ocean market in different downstream markets.(2021-2032)
Chapter 5: Sales, revenue of Small and Medium Industrial Robot in regional level. It provides a quantitative analysis of the market size and development potential of each region and introduces the market development, future development prospects, market space, and market size of each country in the world..(2021-2032)
Chapter 6: Sales, revenue of Small and Medium Industrial Robot in country level. It provides sigmate data by Type, and by Application for each country/region.(2021-2032)
Chapter 7: Provides profiles of key players, introducing the basic situation of the main companies in the market in detail, including product sales, revenue, price, gross margin, product introduction, recent development, etc. (2021-2026)
Chapter 8: Analysis of industrial chain, including the upstream and downstream of the industry.
Chapter 9: Conclusion.

Benefits of purchasing QYResearch report:
Competitive Analysis: QYResearch provides in-depth Small and Medium Industrial Robot competitive analysis, including information on key company profiles, new entrants, acquisitions, mergers, large market shear, opportunities, and challenges. These analyses provide clients with a comprehensive understanding of market conditions and competitive dynamics, enabling them to develop effective market strategies and maintain their competitive edge.

Industry Analysis: QYResearch provides Small and Medium Industrial Robot comprehensive industry data and trend analysis, including raw material analysis, market application analysis, product type analysis, market demand analysis, market supply analysis, downstream market analysis, and supply chain analysis.

and trend analysis. These analyses help clients understand the direction of industry development and make informed business decisions.

Market Size: QYResearch provides Small and Medium Industrial Robot market size analysis, including capacity, production, sales, production value, price, cost, and profit analysis. This data helps clients understand market size and development potential, and is an important reference for business development.

Other relevant reports of QYResearch:
Global Small and Medium Industrial Robot Market Outlook, In‑Depth Analysis & Forecast to 2032
Global Small and Medium Industrial Robot Market Research Report 2026
Global Small and Medium Industrial Robot Sales Market Report, Competitive Analysis and Regional Opportunities 2026-2032

About Us:
QYResearch founded in California, USA in 2007, which is a leading global market research and consulting company. Our primary business include market research reports, custom reports, commissioned research, IPO consultancy, business plans, etc. With over 19 years of experience and a dedicated research team, we are well placed to provide useful information and data for your business, and we have established offices in 7 countries (include United States, Germany, Switzerland, Japan, Korea, China and India) and business partners in over 30 countries. We have provided industrial information services to more than 60,000 companies in over the world.


Contact Us:
If you have any queries regarding this report or if you would like further information, please contact us:
QY Research Inc.
Add: 17890 Castleton Street Suite 369 City of Industry CA 91748 United States
EN: https://www.qyresearch.com
Email: global@qyresearch.com
Tel: 001-626-842-1666(US)
JP: https://www.qyresearch.co.jp

カテゴリー: 未分類 | 投稿者fafa168 18:36 | コメントをどうぞ

Small and Medium Articulated Robot Research:CAGR of 10.2% during the forecast period

QY Research Inc. (Global Market Report Research Publisher) announces the release of 2025 latest report “Small and Medium Articulated Robot- Global Market Share and Ranking, Overall Sales and Demand Forecast 2026-2032”. Based on current situation and impact historical analysis (2020-2024) and forecast calculations (2026-2032), this report provides a comprehensive analysis of the global Small and Medium Articulated Robot market, including market size, share, demand, industry development status, and forecasts for the next few years.

The global market for Small and Medium Articulated Robot was estimated to be worth US$ 3724 million in 2025 and is projected to reach US$ 7022 million, growing at a CAGR of 10.3% from 2026 to 2032.

【Get a free sample PDF of this report (Including Full TOC, List of Tables & Figures, Chart)】
https://www.qyresearch.com/reports/5787307/small-and-medium-articulated-robot


Small and Medium Articulated Robot Market Summary

According to the new market research report “Global Small and Medium Articulated Robot Market Report 2026-2032”, published by QYResearch, the global Small and Medium Articulated Robot market size is projected to reach USD 7.02 billion by 2032, at a CAGR of 10.2% during the forecast period.

Figure00001. Global Small and Medium Articulated Robot Market Size (US$ million), 2026 VS 2032

Small and Medium Articulated Robot

Above data is based on report from QYResearch: Global Small and Medium Articulated Robot Market Report 2021-2032 (published in 2026). If you need the latest data, plaese contact QYResearch.

The small and medium articulated robot market is expanding rapidly as manufacturers seek flexible, high-precision automation solutions across diverse production environments. These robots, typically with 4- to 6-axis configurations and moderate payload capacities, are widely adopted for assembly, welding, material handling, machine tending, polishing, and inspection. Compared with large articulated robots, they offer smaller footprints, lower capital investment, and easier integration into existing production lines. Demand is driven by labor shortages, rising quality requirements, and the need for rapid production changeovers. Their versatility makes them particularly attractive to small and medium-sized manufacturers transitioning from manual or semi-automated processes. As a result, the market is shifting from single-purpose automation toward multi-task, reprogrammable robotic platforms.

Asia-Pacific dominates the global market, led by China, Japan, and South Korea, where dense manufacturing ecosystems and strong automation policies accelerate adoption. China is both the largest demand market and a fast-growing supplier base, supported by localization strategies and domestic robot brands. Japan and South Korea continue to lead in precision engineering and high-reliability articulated robot design. Europe represents a mature but innovation-focused market, with strong demand from automotive, machinery, and metalworking industries. Germany, Italy, and Central Europe are key hubs for articulated robot integration. North America shows steady growth, driven by reshoring initiatives, labor constraints, and advanced manufacturing investments. Emerging markets in Southeast Asia and India are gaining momentum as automation becomes cost-effective.

Major opportunities lie in electronics assembly, lithium battery manufacturing, photovoltaic production, and general industrial automation where flexibility and accuracy are critical. Integration with vision systems, force sensors, and AI-based motion control expands application depth and increases system value. Modular tooling and quick-change end effectors further enhance robot utilization rates. However, market growth is exposed to capital expenditure cycles and macroeconomic uncertainty. Integration complexity and shortages of skilled automation engineers remain adoption barriers for some users. Price competition, especially from rapidly growing domestic suppliers, may pressure margins. Long-term success depends on balancing cost competitiveness with performance and reliability.

Figure00002. Small and Medium Articulated Robot, Global Market Size, Split by Application Segment

Small and Medium Articulated Robot

Based on or includes research from QYResearch: Global Small and Medium Articulated Robot Market Report 2021-2032.

In terms of product application, currently Automotive is the largest segment, hold a share of 21%.


The report provides a detailed analysis of the market size, growth potential, and key trends for each segment. Through detailed analysis, industry players can identify profit opportunities, develop strategies for specific customer segments, and allocate resources effectively.

The Small and Medium Articulated Robot market is segmented as below:
By Company
FANUC
ABB
Yaskawa
KUKA
DENSO Robotics
Universal Robots
Epson
Doosan Robotics
EFORT Intelligent Robot Co.,Ltd.
Delta
OMRON Corporation
Mitsubishi Electric Corporation
Hikrobot
JANOME Corporation
Techrobots
Inovance Group
Guangdong Huayan Robotics Co
SIASUN DUCO
Estun

Segment by Type
<10 Kg Payload Capacity
10–20 Kg Payload Capacity
21–40 Kg Payload Capacity
41–60 Kg Payload Capacity

Segment by Application
Automotive
Electronics
Metal Fabrication Plants
Machinery and Equipment
Logistics and Warehousing
Home Appliance
Others

Each chapter of the report provides detailed information for readers to further understand the Small and Medium Articulated Robot market:

Chapter 1: Introduces the report scope of the Small and Medium Articulated Robot report, global total market size (valve, volume and price). This chapter also provides the market dynamics, latest developments of the market, the driving factors and restrictive factors of the market, the challenges and risks faced by manufacturers in the industry, and the analysis of relevant policies in the industry. (2021-2032)
Chapter 2: Detailed analysis of Small and Medium Articulated Robot manufacturers competitive landscape, price, sales and revenue market share, latest development plan, merger, and acquisition information, etc. (2021-2026)
Chapter 3: Provides the analysis of various Small and Medium Articulated Robot market segments by Type, covering the market size and development potential of each market segment, to help readers find the blue ocean market in different market segments. (2021-2032)
Chapter 4: Provides the analysis of various market segments by Application, covering the market size and development potential of each market segment, to help readers find the blue ocean market in different downstream markets.(2021-2032)
Chapter 5: Sales, revenue of Small and Medium Articulated Robot in regional level. It provides a quantitative analysis of the market size and development potential of each region and introduces the market development, future development prospects, market space, and market size of each country in the world..(2021-2032)
Chapter 6: Sales, revenue of Small and Medium Articulated Robot in country level. It provides sigmate data by Type, and by Application for each country/region.(2021-2032)
Chapter 7: Provides profiles of key players, introducing the basic situation of the main companies in the market in detail, including product sales, revenue, price, gross margin, product introduction, recent development, etc. (2021-2026)
Chapter 8: Analysis of industrial chain, including the upstream and downstream of the industry.
Chapter 9: Conclusion.

Benefits of purchasing QYResearch report:
Competitive Analysis: QYResearch provides in-depth Small and Medium Articulated Robot competitive analysis, including information on key company profiles, new entrants, acquisitions, mergers, large market shear, opportunities, and challenges. These analyses provide clients with a comprehensive understanding of market conditions and competitive dynamics, enabling them to develop effective market strategies and maintain their competitive edge.

Industry Analysis: QYResearch provides Small and Medium Articulated Robot comprehensive industry data and trend analysis, including raw material analysis, market application analysis, product type analysis, market demand analysis, market supply analysis, downstream market analysis, and supply chain analysis.

and trend analysis. These analyses help clients understand the direction of industry development and make informed business decisions.

Market Size: QYResearch provides Small and Medium Articulated Robot market size analysis, including capacity, production, sales, production value, price, cost, and profit analysis. This data helps clients understand market size and development potential, and is an important reference for business development.

Other relevant reports of QYResearch:
Global Small and Medium Articulated Robot Market Outlook, In‑Depth Analysis & Forecast to 2032
Global Small and Medium Articulated Robot Market Research Report 2026
Global Small and Medium Articulated Robot Sales Market Report, Competitive Analysis and Regional Opportunities 2026-2032

About Us:
QYResearch founded in California, USA in 2007, which is a leading global market research and consulting company. Our primary business include market research reports, custom reports, commissioned research, IPO consultancy, business plans, etc. With over 19 years of experience and a dedicated research team, we are well placed to provide useful information and data for your business, and we have established offices in 7 countries (include United States, Germany, Switzerland, Japan, Korea, China and India) and business partners in over 30 countries. We have provided industrial information services to more than 60,000 companies in over the world.


Contact Us:
If you have any queries regarding this report or if you would like further information, please contact us:
QY Research Inc.
Add: 17890 Castleton Street Suite 369 City of Industry CA 91748 United States
EN: https://www.qyresearch.com
Email: global@qyresearch.com
Tel: 001-626-842-1666(US)
JP: https://www.qyresearch.co.jp

カテゴリー: 未分類 | 投稿者fafa168 18:30 | コメントをどうぞ

Small Amusement Device Research:CAGR of 5.4% during the forecast period

QY Research Inc. (Global Market Report Research Publisher) announces the release of 2025 latest report “Small Amusement Device- Global Market Share and Ranking, Overall Sales and Demand Forecast 2026-2032”. Based on current situation and impact historical analysis (2020-2024) and forecast calculations (2026-2032), this report provides a comprehensive analysis of the global Small Amusement Device market, including market size, share, demand, industry development status, and forecasts for the next few years.

The global market for Small Amusement Device was estimated to be worth US$ 2057 million in 2025 and is projected to reach US$ 2959 million, growing at a CAGR of 5.4% from 2026 to 2032.

【Get a free sample PDF of this report (Including Full TOC, List of Tables & Figures, Chart)】
https://www.qyresearch.com/reports/5787315/small-amusement-device


Small Amusement Device Market Summary

According to the new market research report “Global Small Amusement Device Market Report 2026-2032”, published by QYResearch, the global Small Amusement Device market size is projected to reach USD 2.96 billion by 2032, at a CAGR of 5.4% during the forecast period.

Figure00001. Global Small Amusement Device Market Size (US$ million), 2026 VS 2032

Above data is based on report from QYResearch: Global Small Amusement Device Market Report 2021-2032 (published in 2026). If you need the latest data, plaese contact QYResearch.

The small amusement device market has shown resilient growth driven by demand for low-investment, high-turnover entertainment formats. These devices, typically compact, modular, and easy to deploy, are widely used in shopping malls, family entertainment centers, arcades, cinemas, restaurants, and community spaces. Compared with large amusement equipment, small devices offer faster return on investment and greater flexibility in placement. The market is increasingly shaped by frequent product upgrades, including software refreshes, content changes, and hardware modularization. Consumer preferences are shifting toward short, repeatable entertainment experiences rather than long-duration play. As a result, operators favor devices that support rapid theme switching and continuous monetization. Overall, the market is evolving from static mechanical products toward upgrade-driven, experience-oriented entertainment assets.

Asia-Pacific is the largest and most dynamic regional market, led by China, Japan, and South Korea, where dense commercial spaces favor compact amusement formats. China dominates global production and domestic deployment, supported by strong supply chains and fast product iteration cycles. Japan and South Korea emphasize IP-based and character-driven small amusement devices with high design standards. North America represents a stable market with demand concentrated in family entertainment centers and shopping malls. Europe shows moderate growth, with emphasis on safety compliance, durability, and premium design. Emerging markets in Southeast Asia, the Middle East, and Latin America are adopting small amusement devices as commercial entertainment infrastructure expands. Regional differences strongly influence themes, pricing models, and upgrade frequency.

Opportunities are expanding through device upgrades that integrate digital payment systems, online content updates, and data-driven operation management. Licensing popular IPs, animation characters, and game brands enables higher user attraction and pricing power. The rise of “light entertainment” concepts in malls and mixed-use spaces further supports demand. However, the market faces risks from rapid content obsolescence and short product life cycles. Over-reliance on IP licensing can increase costs and reduce margins. Regulatory requirements related to safety, minors, and consumer protection also vary widely by region. Successful players must balance innovation speed with operational stability and compliance.

Figure00002. Small Amusement Device, Global Market Size, Split by Product Segment

Small Amusement Device

Based on or includes research from QYResearch: Global Small Amusement Device Market Report 2021-2032.

In terms of type, currently Kiddie Mechanical Ride is the largest segment, hold a share of 41%.


The report provides a detailed analysis of the market size, growth potential, and key trends for each segment. Through detailed analysis, industry players can identify profit opportunities, develop strategies for specific customer segments, and allocate resources effectively.

The Small Amusement Device market is segmented as below:
By Company
PlayCore
Zamperla
KOMPAN
Amusement Devices Manufacturing, LLC
Antonio Zamperla S.p.A
Fabbri Group
TECHNICAL PARK Srl
COWBOY
Zhongshan Jinbo Amusement Equipment Co., Ltd.
Huaxia Amusement Co., Ltd
Huadong Amusement
Guangzhou Huanledao Fitness Equipment Co., Ltd.
Jinma Entertainment Equipment Co., Ltd
KAIQI Group
Shenyang Chuangqi Amusement Equipment Co

Segment by Type
Kiddie Mechanical Ride
Coin-Operated Kiddie Ride
Soft Play and Non-Powered Device
Portable and Mobile Amusement Device

Segment by Application
Shopping Mall
Playground
Park
Others

Each chapter of the report provides detailed information for readers to further understand the Small Amusement Device market:

Chapter 1: Introduces the report scope of the Small Amusement Device report, global total market size (valve, volume and price). This chapter also provides the market dynamics, latest developments of the market, the driving factors and restrictive factors of the market, the challenges and risks faced by manufacturers in the industry, and the analysis of relevant policies in the industry. (2021-2032)
Chapter 2: Detailed analysis of Small Amusement Device manufacturers competitive landscape, price, sales and revenue market share, latest development plan, merger, and acquisition information, etc. (2021-2026)
Chapter 3: Provides the analysis of various Small Amusement Device market segments by Type, covering the market size and development potential of each market segment, to help readers find the blue ocean market in different market segments. (2021-2032)
Chapter 4: Provides the analysis of various market segments by Application, covering the market size and development potential of each market segment, to help readers find the blue ocean market in different downstream markets.(2021-2032)
Chapter 5: Sales, revenue of Small Amusement Device in regional level. It provides a quantitative analysis of the market size and development potential of each region and introduces the market development, future development prospects, market space, and market size of each country in the world..(2021-2032)
Chapter 6: Sales, revenue of Small Amusement Device in country level. It provides sigmate data by Type, and by Application for each country/region.(2021-2032)
Chapter 7: Provides profiles of key players, introducing the basic situation of the main companies in the market in detail, including product sales, revenue, price, gross margin, product introduction, recent development, etc. (2021-2026)
Chapter 8: Analysis of industrial chain, including the upstream and downstream of the industry.
Chapter 9: Conclusion.

Benefits of purchasing QYResearch report:
Competitive Analysis: QYResearch provides in-depth Small Amusement Device competitive analysis, including information on key company profiles, new entrants, acquisitions, mergers, large market shear, opportunities, and challenges. These analyses provide clients with a comprehensive understanding of market conditions and competitive dynamics, enabling them to develop effective market strategies and maintain their competitive edge.

Industry Analysis: QYResearch provides Small Amusement Device comprehensive industry data and trend analysis, including raw material analysis, market application analysis, product type analysis, market demand analysis, market supply analysis, downstream market analysis, and supply chain analysis.

and trend analysis. These analyses help clients understand the direction of industry development and make informed business decisions.

Market Size: QYResearch provides Small Amusement Device market size analysis, including capacity, production, sales, production value, price, cost, and profit analysis. This data helps clients understand market size and development potential, and is an important reference for business development.

Other relevant reports of QYResearch:
Global Small Amusement Device Market Outlook, In‑Depth Analysis & Forecast to 2032
Global Small Amusement Device Market Research Report 2026
Global Small Amusement Device Sales Market Report, Competitive Analysis and Regional Opportunities 2026-2032

About Us:
QYResearch founded in California, USA in 2007, which is a leading global market research and consulting company. Our primary business include market research reports, custom reports, commissioned research, IPO consultancy, business plans, etc. With over 19 years of experience and a dedicated research team, we are well placed to provide useful information and data for your business, and we have established offices in 7 countries (include United States, Germany, Switzerland, Japan, Korea, China and India) and business partners in over 30 countries. We have provided industrial information services to more than 60,000 companies in over the world.


Contact Us:
If you have any queries regarding this report or if you would like further information, please contact us:
QY Research Inc.
Add: 17890 Castleton Street Suite 369 City of Industry CA 91748 United States
EN: https://www.qyresearch.com
Email: global@qyresearch.com
Tel: 001-626-842-1666(US)
JP: https://www.qyresearch.co.jp

カテゴリー: 未分類 | 投稿者fafa168 18:21 | コメントをどうぞ

Rental Transparent LED Display Research:with a compound annual growth rate (CAGR) of 24.2%

QY Research Inc. (Global Market Report Research Publisher) announces the release of 2025 latest report “Rental Transparent LED Display- Global Market Share and Ranking, Overall Sales and Demand Forecast 2026-2032”. Based on current situation and impact historical analysis (2020-2024) and forecast calculations (2026-2032), this report provides a comprehensive analysis of the global Rental Transparent LED Display market, including market size, share, demand, industry development status, and forecasts for the next few years.

The global market for Rental Transparent LED Display was estimated to be worth US$ 178 million in 2025 and is projected to reach US$ 797 million, growing at a CAGR of 24.2% from 2026 to 2032.

【Get a free sample PDF of this report (Including Full TOC, List of Tables & Figures, Chart)】
https://www.qyresearch.com/reports/6069946/rental-transparent-led-display


Rental Transparent LED Display

The rental transparent LED display is an innovative display device that combines high transparency with flexible rental services. Its core feature is the use of hollow design or micro-LED technology, which enables dynamic content display while maintaining a 50%-90% transparency rate. It does not affect the lighting and visual transparency of the building, and can enhance the sense of technology and commercial value of the space through multimedia content. When using the rental model, users do not need to bear the cost of equipment procurement and maintenance. They can flexibly choose the screen size, resolution and special-shaped splicing solutions according to their needs, and enjoy the rapid installation, debugging and content adaptation services of a professional team. Technically, the product usually has high brightness, wide viewing angle, low power consumption and modular structure, supports seamless splicing and remote control, and can still maintain stable operation in complex environments. Some high-end models are also equipped with energy-saving cooling systems and waterproof functions, taking into account environmental protection and outdoor adaptability. With customized creative content, it can create an immersive visual experience that combines virtuality and reality for various scenes.


According to the latest QYResearch report, the global Rental Transparent LED Display market is expected to reach US$ 217.17 million in 2025, with a compound annual growth rate (CAGR) of 24.2%.

Manufacturing companies include Daktronics, Eager LED, Unilumin, Leyard, Dicolor LED, Gloshine Technology, Showtechled, Chenxiang Photoelectric, Meiyad Optoelectronics, Radiant Technology, Premteco, LCF LED, Guoxin Optoelectronics, Yuchip Electronic, SUNMAX Photoelectric Display.

Company Name

Description

Daktronics

Daktronics is a world leader in the design, engineering, and manufacturing of digital LED display technology and audio systems. The company also installs and services reliable, long-lasting digital solutions—including scoreboards, video boards, message displays, and billboards—along with intuitive software used to control these systems.

Eager LED

Since its establishment in 2009, EagerLED has been engaged in indoor and outdoor LED displays, and has become one of the leaders in the field of LED displays. EagerLED attaches great importance to the research and development of LED products. After more than 10 years of development, EagerLED products sell well in more than 90 countries and regions around the world.

Unilumin

As a leading global provider of LED display and lighting products and optical solutions, Unilumin is a recipient of the National Science and Technology Progress Award (First Prize) and the Ministry of Industry and Information Technology’s Manufacturing Single Champion Award. It leads in LED display sales and shipment area, market share in rental displays, and market share in XR virtual photography. As a globally operating high-tech company, Unilumin has R&D centers in China, Japan, and the United States, a sales and service network covering more than 160 countries and regions worldwide, and the world’s largest intelligent manufacturing base for LED displays.

Leyard

Founded in 1995, Leyard Group has been maintaining high growth after being listed on the Shenzhen Stock Exchange. Display remains No.1 in global market share for five consecutive years. Leyard enjoys high brand awareness and reputation at home and abroad thanks to its involvement and professional service in many major events, including the Olympic Games, the World Expo, the NBA games, the German Bundestag (Federal Parliament), etc.Focusing on activities in the intelligent display, urban light environment, new cultural tourism business forms, and VR technology.


Figure00002. Rental Transparent LED Display Value Chain
Rental Transparent LED Display

Source: Secondary Sources, Expert Interviews and QYResearch, 2025


The upstream supply chain for rental transparent LED displays primarily includes suppliers of core raw materials and key components, such as LED chips, PCBs, driver ICs, module components, power supplies, and control systems. Representative domestic companies include San’an Optoelectronics, Lianchuang Electronics, and HC Semitek, while international companies include Samsung, Cree, Nichia, and Osram. Downstream applications encompass performance stages, commercial displays, expositions, advertising media, sporting events, and public events. Domestic clients include CCTV studios, major shopping malls, and exhibition centers, while international customers include Coachella, Times Square advertising screens, and international exhibition centers. This collaborative effort has driven the rapid adoption and widespread adoption of transparent LED displays for rental and temporary displays in diverse scenarios.

Market Drivers:

Demand for rental transparent LED displays is driven by the concert/exhibition economy, stagecraft upgrades, and experience-based branding. Live events (concerts, exhibitions, launches, sports, large commercial shows) increasingly require fast deployment, repeatable utilization, and high-impact visuals; transparent LEDs add depth and “see-through” aesthetics, enabling dynamic content without fully blocking lighting, set design, or sightlines. Rental use cases prioritize lightweight panels, quick-lock mechanics, front/rear serviceability, and high reliability—pushing continuous improvements in mechanical design, thermal management, and shock/vibration tolerance. Meanwhile, more mature content pipelines and real-time control (media servers, sync systems, XR/AR stages) raise the usability and ROI of transparent screens in complex productions.

Restraint:

Key restraints include the inherent trade-off between transparency and display performance, and the reliability/maintenance burden under rental duty cycles. Transparent LEDs often require compromises in pixel density, brightness/contrast, viewing angle, and black uniformity to preserve see-through characteristics; strong ambient light and long viewing distances place tougher demands on brightness and image quality. High turnover in rental operations increases damage risk, latch wear, and connector/power/receiver-card failures, raising requirements for mechanical robustness, EMC stability, and rapid repair. In addition, transparent screens are more sensitive to rigging safety, power/signal redundancy, and on-site calibration/color consistency; without standardized O&M, total cost of ownership rises and re-rental rates suffer.

Opportunity:

Opportunities lie in premium stage/immersive experiences, platformized products, and service-led delivery. As live productions pursue deeper immersion and spatial storytelling, transparent LEDs integrate well with lighting, kinetic stages, interactive installations, and XR/AR to create differentiated visual assets. Rental companies increasingly prefer modular, standardized platforms (common cabinets, swappable spares, unified control stacks) that maximize cross-project reuse—favoring manufacturers with scalable production and coherent product families. Moreover, integrated delivery models—hardware plus content support and full O&M (rigging engineering, calibration, backup units, rapid response)—are becoming decisive, enabling players with strong engineering execution and service footprints to capture higher value in premium projects.

Barriers to Entry:

Entry barriers are driven by engineering-grade mechanical/electro-optical integration, long-term reliability validation, and rental-channel delivery capability. Rental transparent LEDs must meet pixel/brightness/refresh/grayscale targets while balancing lightweight design with strength, ensuring latches, frames, and protection remain consistent across repeated assembly, transport, and impacts. Suppliers need rigorous incoming/production quality control, shock/vibration testing, EMC and safety compliance, and field-friendly replaceable modules/power/receiver systems to minimize downtime. Commercially, top rental houses and major production integrators prioritize proven references, execution quality, and aftersales responsiveness; new entrants must build credibility through project track records, spare-part systems, and service networks to enter core supply chains and achieve repeat purchases.


The report provides a detailed analysis of the market size, growth potential, and key trends for each segment. Through detailed analysis, industry players can identify profit opportunities, develop strategies for specific customer segments, and allocate resources effectively.

The Rental Transparent LED Display market is segmented as below:
By Company
Daktronics
Eager LED
Unilumin
Leyard
Dicolor LED
Gloshine Technology
Showtechled
Chenxiang Photoelectric
Meiyad Optoelectronics
Radiant Technology
Premteco
LCF LED
Guoxin Optoelectronics
Yuchip Electronic
SUNMAX Photoelectric Display

Segment by Type
Indoor Display
Outdoor Display

Segment by Application
Stage Performances
Conferences and Exhibitions
Sports Competitions
Others

Each chapter of the report provides detailed information for readers to further understand the Rental Transparent LED Display market:

Chapter 1: Introduces the report scope of the Rental Transparent LED Display report, global total market size (valve, volume and price). This chapter also provides the market dynamics, latest developments of the market, the driving factors and restrictive factors of the market, the challenges and risks faced by manufacturers in the industry, and the analysis of relevant policies in the industry. (2021-2032)
Chapter 2: Detailed analysis of Rental Transparent LED Display manufacturers competitive landscape, price, sales and revenue market share, latest development plan, merger, and acquisition information, etc. (2021-2026)
Chapter 3: Provides the analysis of various Rental Transparent LED Display market segments by Type, covering the market size and development potential of each market segment, to help readers find the blue ocean market in different market segments. (2021-2032)
Chapter 4: Provides the analysis of various market segments by Application, covering the market size and development potential of each market segment, to help readers find the blue ocean market in different downstream markets.(2021-2032)
Chapter 5: Sales, revenue of Rental Transparent LED Display in regional level. It provides a quantitative analysis of the market size and development potential of each region and introduces the market development, future development prospects, market space, and market size of each country in the world..(2021-2032)
Chapter 6: Sales, revenue of Rental Transparent LED Display in country level. It provides sigmate data by Type, and by Application for each country/region.(2021-2032)
Chapter 7: Provides profiles of key players, introducing the basic situation of the main companies in the market in detail, including product sales, revenue, price, gross margin, product introduction, recent development, etc. (2021-2026)
Chapter 8: Analysis of industrial chain, including the upstream and downstream of the industry.
Chapter 9: Conclusion.

Benefits of purchasing QYResearch report:
Competitive Analysis: QYResearch provides in-depth Rental Transparent LED Display competitive analysis, including information on key company profiles, new entrants, acquisitions, mergers, large market shear, opportunities, and challenges. These analyses provide clients with a comprehensive understanding of market conditions and competitive dynamics, enabling them to develop effective market strategies and maintain their competitive edge.

Industry Analysis: QYResearch provides Rental Transparent LED Display comprehensive industry data and trend analysis, including raw material analysis, market application analysis, product type analysis, market demand analysis, market supply analysis, downstream market analysis, and supply chain analysis.

and trend analysis. These analyses help clients understand the direction of industry development and make informed business decisions.

Market Size: QYResearch provides Rental Transparent LED Display market size analysis, including capacity, production, sales, production value, price, cost, and profit analysis. This data helps clients understand market size and development potential, and is an important reference for business development.

Other relevant reports of QYResearch:
Global Rental Transparent LED Display Market Outlook, In‑Depth Analysis & Forecast to 2032
Global Rental Transparent LED Display Market Research Report 2026
Global Rental Transparent LED Display Sales Market Report, Competitive Analysis and Regional Opportunities 2026-2032

About Us:
QYResearch founded in California, USA in 2007, which is a leading global market research and consulting company. Our primary business include market research reports, custom reports, commissioned research, IPO consultancy, business plans, etc. With over 19 years of experience and a dedicated research team, we are well placed to provide useful information and data for your business, and we have established offices in 7 countries (include United States, Germany, Switzerland, Japan, Korea, China and India) and business partners in over 30 countries. We have provided industrial information services to more than 60,000 companies in over the world.


Contact Us:
If you have any queries regarding this report or if you would like further information, please contact us:
QY Research Inc.
Add: 17890 Castleton Street Suite 369 City of Industry CA 91748 United States
EN: https://www.qyresearch.com
Email: global@qyresearch.com
Tel: 001-626-842-1666(US)
JP: https://www.qyresearch.co.jp

カテゴリー: 未分類 | 投稿者fafa168 18:06 | コメントをどうぞ