

QY Research Inc. (Global Market Report Research Publisher) announces the release of 2025 latest report “Heat-not-Burn (HnB) Tobacco- Global Market Share and Ranking, Overall Sales and Demand Forecast 2026-2032”. Based on current situation and impact historical analysis (2020-2024) and forecast calculations (2026-2032), this report provides a comprehensive analysis of the global Heat-not-Burn (HnB) Tobacco market, including market size, share, demand, industry development status, and forecasts for the next few years.
The global market for Heat-not-Burn (HnB) Tobacco was estimated to be worth US$ 28410 million in 2025 and is projected to reach US$ 144270 million, growing at a CAGR of 26.5% from 2026 to 2032.
【Get a free sample PDF of this report (Including Full TOC, List of Tables & Figures, Chart)】
https://www.qyresearch.com/reports/6017593/heat-not-burn–hnb–tobacco
Product Overview and Scope of Heat-not-Burn (HnB) Tobacco
HNB tobacco products (Heat-Not-Burn Tobacco) refer to a new type of tobacco product that uses an electronic heating device to heat specially prepared tobacco raw materials to 250°C–350°C (lower than the combustion temperature of traditional cigarettes 600°C–900°C), causing the nicotine and flavor compounds in the tobacco to volatilize and form an aerosol for the user to inhale.
HNB tobacco products use reconstituted tobacco leaves as the core matrix, blended with tobacco fragments, stems, and tobacco sheets to optimize combustion characteristics. A large amount of glycerin and propylene glycol (up to 20%-30%) are added as aerosol generators to produce visible vapor. Food-grade binders, humectants, and flavorings are also used. The filter uses a composite design of cellulose acetate, polylactic acid (PLA) film cooling section, and hollow paper structure. The overall raw materials are highly dependent on a special tobacco formula with specific physicochemical properties, and stringent requirements are placed on glycerin purity, leak-proof logistics, and temperature-controlled storage.
The cost structure exhibits a “dual-track differentiation” characteristic: On the cartridge production side, the complexity of the specially formulated reconstituted tobacco process, the price fluctuations of a high proportion of aerosol generating agents (glycerin is affected by the biodiesel and chemical markets), and the investment in precision rolling and packaging equipment result in a significantly higher per-cigarette manufacturing cost compared to traditional cigarettes. On the device side, the high cost of precision hardware such as ceramic heating elements, platinum resistance temperature sensors, lithium batteries, and microelectronic systems, along with high technology licensing fees due to patent barriers, leads to substantial initial capital expenditure (CAPEX). Although the devices can be reused to amortize long-term costs, the high-frequency repurchase characteristics of cartridges and the control of tobacco monopoly channels maintain a high-margin, high-barrier cost structure for this category, with regulatory compliance and hazardous substance testing fees further squeezing profit margins.
Heat-not-Burn (HnB) Tobacco Market Summary
According to the new market research report “Global Heat-not-Burn (HnB) Tobacco Market Report 2026-2032”, published by QYResearch, the global Heat-not-Burn (HnB) Tobacco market size is projected to reach USD 117.06 billion by 2032, at a CAGR of 22.2% during the forecast period.
Figure00002. Global Heat-not-Burn (HnB) Tobacco Market Size (US$ Million), 2021-2032
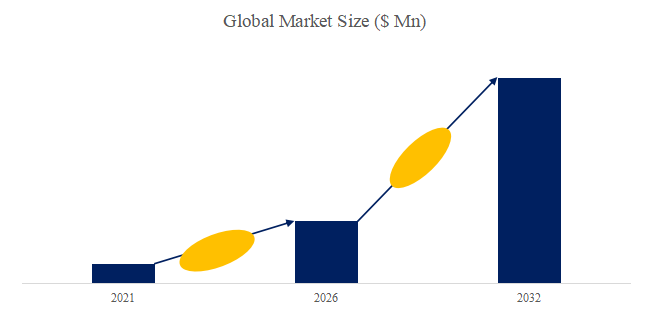
Above data is based on report from QYResearch: Global Heat-not-Burn (HnB) Tobacco Market Report 2026-2032 (published in 2025). If you need the latest data, plaese contact QYResearch.
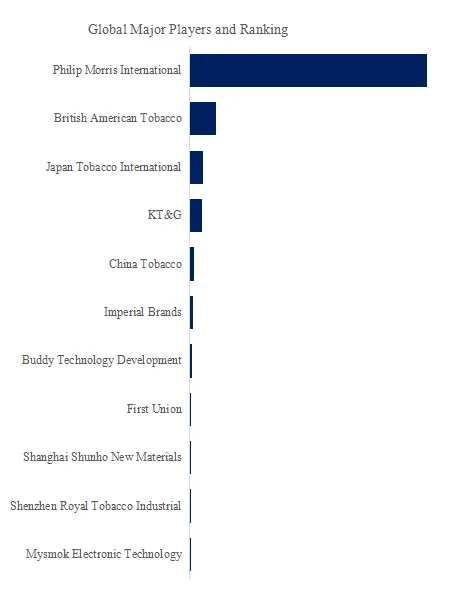
Figure00003. Global Heat-not-Burn (HnB) Tobacco Top 11 Players Ranking and Market Share (Ranking is based on the revenue of 2025, continually updated)
Above data is based on report from QYResearch: Global Heat-not-Burn (HnB) Tobacco Market Report 2026-2032 (published in 2025). If you need the latest data, plaese contact QYResearch.
According to QYResearch Top Players Research Center, the global key manufacturers of Heat-not-Burn (HnB) Tobacco include Philip Morris International, British American Tobacco, Japan Tobacco International, KT&G, China Tobacco, Imperial Brands, Buddy Technology Development, First Union, Shanghai Shunho New Materials, Shenzhen Royal Tobacco Industrial, etc. In 2025, the global top five players had a share approximately 94.0% in terms of revenue.
Figure00004. Heat-not-Burn (HnB) Tobacco, Global Market Size, Split by Product Segment
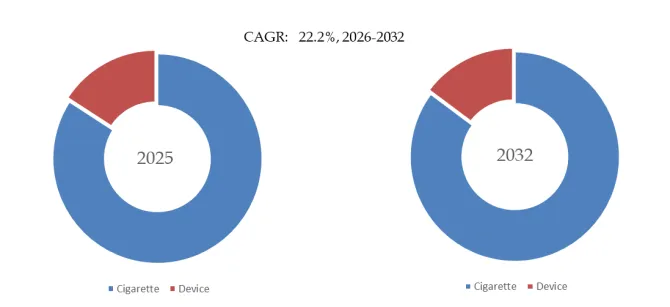
Based on or includes research from QYResearch: Global Heat-not-Burn (HnB) Tobacco Market Report 2026-2032.
In terms of product type, currently Cigarette is the largest segment, hold a share of 84.2%.
In terms of product application, currently Offline is the largest segment, hold a share of 52.1%.
The report provides a detailed analysis of the market size, growth potential, and key trends for each segment. Through detailed analysis, industry players can identify profit opportunities, develop strategies for specific customer segments, and allocate resources effectively.
The Heat-not-Burn (HnB) Tobacco market is segmented as below:
By Company
Philip Morris International
British American Tobacco
Japan Tobacco
Imperial Brands
Altria
South Korea KT&G
China Tobacco Group
Compaq
Smoke Frog Technology
Avi Badi
Korea Tobacco & Ginseng Corporation
American electronic cigarette company
VMR Products
Segment by Type
Use Tobacco Stick
Use Loose-leaf
Segment by Application
Supermarket
Tobacco Store
Official Website
Third-party Shopping Platform
Other
Each chapter of the report provides detailed information for readers to further understand the Heat-not-Burn (HnB) Tobacco market:
Chapter 1: Introduces the report scope of the Heat-not-Burn (HnB) Tobacco report, global total market size (valve, volume and price). This chapter also provides the market dynamics, latest developments of the market, the driving factors and restrictive factors of the market, the challenges and risks faced by manufacturers in the industry, and the analysis of relevant policies in the industry. (2021-2032)
Chapter 2: Detailed analysis of Heat-not-Burn (HnB) Tobacco manufacturers competitive landscape, price, sales and revenue market share, latest development plan, merger, and acquisition information, etc. (2021-2026)
Chapter 3: Provides the analysis of various Heat-not-Burn (HnB) Tobacco market segments by Type, covering the market size and development potential of each market segment, to help readers find the blue ocean market in different market segments. (2021-2032)
Chapter 4: Provides the analysis of various market segments by Application, covering the market size and development potential of each market segment, to help readers find the blue ocean market in different downstream markets.(2021-2032)
Chapter 5: Sales, revenue of Heat-not-Burn (HnB) Tobacco in regional level. It provides a quantitative analysis of the market size and development potential of each region and introduces the market development, future development prospects, market space, and market size of each country in the world..(2021-2032)
Chapter 6: Sales, revenue of Heat-not-Burn (HnB) Tobacco in country level. It provides sigmate data by Type, and by Application for each country/region.(2021-2032)
Chapter 7: Provides profiles of key players, introducing the basic situation of the main companies in the market in detail, including product sales, revenue, price, gross margin, product introduction, recent development, etc. (2021-2026)
Chapter 8: Analysis of industrial chain, including the upstream and downstream of the industry.
Chapter 9: Conclusion.
Benefits of purchasing QYResearch report:
Competitive Analysis: QYResearch provides in-depth Heat-not-Burn (HnB) Tobacco competitive analysis, including information on key company profiles, new entrants, acquisitions, mergers, large market shear, opportunities, and challenges. These analyses provide clients with a comprehensive understanding of market conditions and competitive dynamics, enabling them to develop effective market strategies and maintain their competitive edge.
Industry Analysis: QYResearch provides Heat-not-Burn (HnB) Tobacco comprehensive industry data and trend analysis, including raw material analysis, market application analysis, product type analysis, market demand analysis, market supply analysis, downstream market analysis, and supply chain analysis.
and trend analysis. These analyses help clients understand the direction of industry development and make informed business decisions.
Market Size: QYResearch provides Heat-not-Burn (HnB) Tobacco market size analysis, including capacity, production, sales, production value, price, cost, and profit analysis. This data helps clients understand market size and development potential, and is an important reference for business development.
Other relevant reports of QYResearch:
Global Heat-not-Burn (HnB) Tobacco Market Outlook, In‑Depth Analysis & Forecast to 2032
Global Heat-not-Burn (HnB) Tobacco Sales Market Report, Competitive Analysis and Regional Opportunities 2026-2032
Global Heat-not-Burn (HnB) Tobacco Market Research Report 2026
About Us:
QYResearch founded in California, USA in 2007, which is a leading global market research and consulting company. Our primary business include market research reports, custom reports, commissioned research, IPO consultancy, business plans, etc. With over 19 years of experience and a dedicated research team, we are well placed to provide useful information and data for your business, and we have established offices in 7 countries (include United States, Germany, Switzerland, Japan, Korea, China and India) and business partners in over 30 countries. We have provided industrial information services to more than 60,000 companies in over the world.
Contact Us:
If you have any queries regarding this report or if you would like further information, please contact us:
QY Research Inc.
Add: 17890 Castleton Street Suite 369 City of Industry CA 91748 United States
EN: https://www.qyresearch.com
Email: global@qyresearch.com
Tel: 001-626-842-1666(US)
JP: https://www.qyresearch.co.jp


