日別アーカイブ: 2026年4月28日

Coolant Distribution Units (CDU) Research:CAGR of 18.5% during the forecast period

Coolant Distribution Units (CDU) Market Summary

Coolant Distribution Unit (CDU) is an essential component in liquid cooling systems that distribute coolant or water evenly throughout the system. The CDU regulates and controls the flow of coolant, maintaining the desired temperature and flow rate. It works in conjunction with pumps, radiators, heat exchangers, and control units to ensure the cooling system runs smoothly and efficiently. The CDU also helps keep the system clean by removing impurities from the coolant, preventing clogging and damage to other components in the system. Overall, the CDU plays a critical role in maintaining the proper functioning of liquid cooling systems.


Above data is based on report from QYResearch: Global Coolant Distribution Units (CDU) Market Report 2026-2032 (published in 2026). If you need the latest data, plaese contact QYResearch.

Fast Market Growth: In the current landscape dominated by AI-driven applications and dense chip architectures, liquid cooling has emerged as a pivotal technology. CDU, as a key part in liquid cooling system, will benefit from the prevalence of AI and high-performance computing (HPC). The CDU market is expected to experience fast growth in the coming years.

Intensified Competition: As showing great market potential, many investors and companies have laid their attentions on the CDU market. With more and more companies will enter in the CDU industry, the whole market competition will be intensified in the coming years.

Continued Technology Innovation: CDU include liquid-to-liquid and liquid-to-air types. Though limited in cooling capability compared with liquid-to-liquid CDUs, liquid-to-air CDUs don’t require water pipes, can be installed more easily, and take less space and lower initial cost than liquid-to-liquid CDUs. While although liquid-to-liquid CDUs hold the best cooling performance of all types. They require, among others, pipes to be installed to operate with a facility’s water. More research and technology innovation will be put on liquid-to-liquid CDUs by CDU manufacturers to provide high performance CDU to data centers.

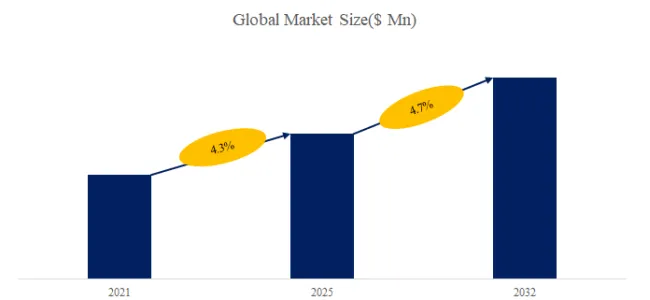
According to the new market research report “Global Coolant Distribution Units (CDU) Market Report 2026-2032″, published by QYResearch, the global Coolant Distribution Units (CDU) market size is projected to grow from USD 1,337 million in 2025 to USD 4,427 million by 2032, at a CAGR of 18.5% during the forecast period.

Figure00002. Global Coolant Distribution Units (CDU) Market Size (US$ Million), 2021-2032

Coolant Distribution Units (CDU)

Above data is based on report from QYResearch: Global Coolant Distribution Units (CDU) Market Report 2026-2032 (published in 2026). If you need the latest data, plaese contact QYResearch.

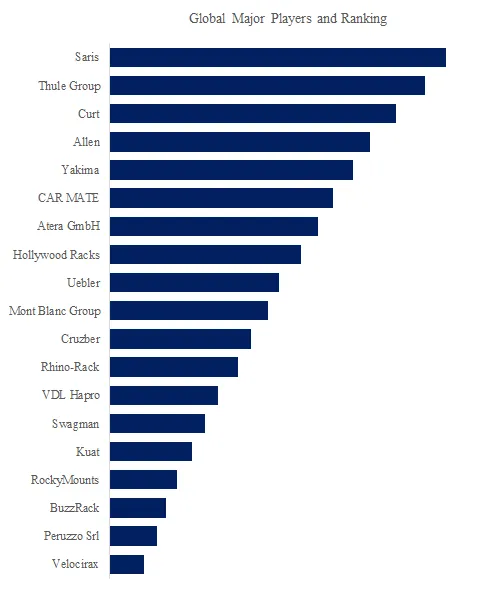
Figure00003. Global Coolant Distribution Units (CDU) Top 10 Players Ranking and Market Share (Ranking is based on the revenue of 2025, continually updated)

Coolant Distribution Units (CDU)

Above data is based on report from QYResearch: Global Coolant Distribution Units (CDU) Market Report 2026-2032 (published in 2026). If you need the latest data, plaese contact QYResearch.

This report profiles key players of Coolant Distribution Units (CDU) such as Vertiv, Nidec, Schneider Electric, nVent, Envicool.

In 2025, the global top three Coolant Distribution Units (CDU) players account for 48% of market share in terms of revenue. Above figure shows the key players ranked by revenue in Coolant Distribution Units (CDU).


Market Drivers:

One of the primary drivers behind the uptick in liquid cooling adoption is the escalating power density of modern IT equipment. With the proliferation of high-performance servers, GPUs, and AI accelerators, data centers are generating more heat than ever before. Traditional air-cooling systems struggle to effectively dissipate the heat generated by these dense workloads, leading to hotspots and reduced operational efficiency. Liquid cooling, on the other hand, offers a more efficient means of heat transfer and dissipation. By circulating coolant directly in contact with hot components, such as processors and graphics cards, liquid cooling systems can effectively remove heat at a faster rate than air-based solutions. This capability enables data centers to accommodate higher power densities while maintaining optimal operating temperatures, thereby improving overall performance and energy efficiency.

Restraint:

Air cooling uses air conditioning, fans, and vents to circulate ambient air, expelling the hot air produced by computing equipment. It’s the most traditional method and forms the basis for many data center cooling strategies. Compared with traditional air-cooling technology, the installation with additional power and water, higher cost as well as other questions bring great challenges to promote liquid cooling technology market share, which will impact the demand of CDU accordingly.

Opportunity:

As data center footprints continue to shrink due to urbanization and real estate constraints, optimizing space utilization has become a pressing priority for data center managers. Liquid cooling solutions offer a compact and space-efficient alternative to traditional air-cooling systems, enabling data centers to maximize their rack densities and floor space without compromising thermal performance. Moreover, the scalability of liquid cooling systems makes them well-suited for accommodating future growth and expansion. By modularizing cooling infrastructure and deploying liquid cooling units in a distributed manner, data centers can easily scale their cooling capacity in response to changing workload demands. This flexibility not only enhances operational agility but also streamlines the deployment of new IT equipment without the need for extensive retrofitting or reconfiguration.


About The Authors

Maocai Zhang – Lead Author
Email: zhangmaocai@qyresearch.com


About QYResearch

QYResearch founded in California, USA in 2007. It is a leading global market research and consulting company. With over 19 years’ experience and professional research team in various cities over the world QY Research focuses on management consulting, database and seminar services, IPO consulting (data is widely cited in prospectuses, annual reports and presentations), industry chain research and customized research to help our clients in providing non-linear revenue model and make them successful. We are globally recognized for our expansive portfolio of services, good corporate citizenship, and our strong commitment to sustainability. Up to now, we have cooperated with more than 70,000 clients across five continents. Let’s work closely with you and build a bold and better future.

QYResearch is a world-renowned large-scale consulting company. The industry covers various high-tech industry chain market segments, spanning the semiconductor industry chain (semiconductor equipment and parts, semiconductor materials, ICs, Foundry, packaging and testing, discrete devices, sensors, optoelectronic devices), photovoltaic industry chain (equipment, cells, modules, auxiliary material brackets, inverters, power station terminals), new energy automobile industry chain (batteries and materials, auto parts, batteries, motors, electronic control, automotive semiconductors, etc.), communication industry chain (communication system equipment, terminal equipment, electronic components, RF front-end, optical modules, 4G/5G/6G, broadband, IoT, digital economy, AI), advanced materials industry Chain (metal materials, polymer materials, ceramic materials, nano materials, etc.), machinery manufacturing industry chain (CNC machine tools, construction machinery, electrical machinery, 3C automation, industrial robots, lasers, industrial control, drones), food, beverages and pharmaceuticals, medical equipment, agriculture, etc.


About Us:
QYResearch founded in California, USA in 2007, which is a leading global market research and consulting company. Our primary business include market research reports, custom reports, commissioned research, IPO consultancy, business plans, etc. With over 18 years of experience and a dedicated research team, we are well placed to provide useful information and data for your business, and we have established offices in 7 countries (include United States, Germany, Switzerland, Japan, Korea, China and India) and business partners in over 30 countries. We have provided industrial information services to more than 60,000 companies in over the world.

Contact Us:
If you have any queries regarding this report or if you would like further information, please contact us:
QY Research Inc.
Add: 17890 Castleton Street Suite 369 City of Industry CA 91748 United States
EN: https://www.qyresearch.com
Email: global@qyresearch.com
Tel: 001-626-842-1666(US)
JP: https://www.qyresearch.co.jp

カテゴリー: 未分類 | 投稿者huangsisi 12:16 | コメントをどうぞ

Vehicle Bicycle Rack Research:CAGR of 4.7% during the forecast period

Vehicle Bicycle Rack Market Summary

Vehicle Bicycle Racks are external carrier systems mounted on cars, SUVs, and vans to transport bicycles safely without taking up cabin space. Common types include hitch-mounted racks, roof racks, trunk-mounted racks, and spare-tire-mounted racks, designed to accommodate different bike frames, wheelbases, and tire widths including heavier e-bikes. Key requirements include load capacity, secure clamping and anti-sway mechanisms, corrosion resistance, compatibility with vehicle mounting points, and safety features such as locks, light board integration, and fold/tilt functions for rear hatch access. Premium racks focus on tool-free installation, quick-release arms, adjustable trays, and reduced bike-to-bike contact to prevent scratches. Many markets require compliance with road safety rules regarding license plate visibility and lighting when bikes extend beyond the vehicle profile.


The industrial chain of Vehicle Bicycle Racks includes upstream materials such as steel and aluminum tubes, cast or forged brackets, fasteners, rubber pads, straps, locks, powder coatings, and packaging. Midstream manufacturing covers cutting, bending, welding, machining, surface treatment, assembly, and load testing. Downstream users include vehicle accessory brands, automotive dealers, outdoor retailers, and e-commerce platforms, serving consumers, rental fleets, and cycling events. Services include fitment guidance, installation support, spare parts supply, warranty service, and replacement of wear items such as straps and locks.


In 2025, global Vehicle Bicycle Rack production reached approximately 1,900 k units,with an average global market price of around US$ 260 per unit, and a gross profit margin of approximately 10%-30%. According to the new market research report “Global Vehicle Bicycle Rack Market Report 2026-2032”, published by QYResearch, the global Vehicle Bicycle Rack market size is projected to reach USD 0.68 billion by 2032, at a CAGR of 4.7% during the forecast period.


Global Vehicle Bicycle Rack Market Size (US$ Million), 2020-2031

Vehicle Bicycle Rack

Above data is based on report from QYResearch: Global Vehicle Bicycle Rack Market Report 2021-2032 (published in 2025). If you need the latest data, plaese contact QYResearch.

Global Vehicle Bicycle Rack Top 5 Players Ranking and Market Share (Ranking is based on the revenue of 2025, continually updated)

Vehicle Bicycle Rack

Above data is based on report from QYResearch: Global Vehicle Bicycle Rack Market Report 2026-2032 (published in 2025). If you need the latest data, plaese contact QYResearch.

According to QYResearch Top Players Research Center, the global key manufacturers of Vehicle Bicycle Rack include Saris, Thule Group, Curt, Allen, Yakima, CAR MATE, Atera GmbH, Hollywood Racks, Uebler, Mont Blanc Group, etc. In 2025, the global top five players had a share approximately 42.0% in terms of revenue.

Vehicle Bicycle Rack Market Trends

1. “E-bike weight” is reshaping the product mix

Demand is shifting toward heavy-duty hitch/platform racks designed for e-bikes (higher per-bike load ratings, stronger arms/trays). Thule positions Epos specifically for “heavy e-bikes” and highlights high per-bike capacity.


2. More racks are “modular”: 2-bike base + add-on to 3–4 bikes

Premium platform racks increasingly sell as a 2-bike core with an add-on module (higher ASP + accessory attachment rate).


3. Convenience features are becoming baseline (fold/tilt/tool-free)

Competitive differentiation is heavily about ease of use: foldable storage, tilt for trunk access, and tool-free mounting/locking knobs. Thule and Yakima both lead with fold/tilt and user-friendly handling.


4. Lighting + license plate visibility is pushing “light board / integrated lights” adoption (especially EU)

In Europe, if a rear rack obscures the plate or rear lights, users typically need a light/plate board (signal ramp) or integrated solutions. Retail guidance explicitly calls this out, and manufacturers increasingly offer integrated/optional light kits.

Vehicle Bicycle Rack Market Driving Factors and Opportunities

1. E-bike adoption → heavier load requirements

More e-bikes (and e-MTBs) push consumers toward high-capacity hitch/platform racks with higher per-bike load ratings and stronger retention systems. Thule markets Epos with 30 kg/bike capacity explicitly for heavy e-bikes.

2. Regulatory/road-compliance pressure (rear lights & plate visibility, EU)

In many European countries, if a rear rack obscures the license plate or tail lights, users must add a light/plate board (or equivalent duplication), driving demand for integrated lighting kits and compliant accessories.

3. Modern bike geometries increase compatibility needs

Growth in long-wheelbase MTBs, larger tires, and non-traditional frames (step-through e-bikes) favors racks designed for long wheelbases and broader fitment.


About The Authors

Zhangyu – Lead Author
Email:zhangyu@qyresearch.com


About QYResearch

QYResearch founded in California, USA in 2007. It is a leading Global market research and consulting company. With over 17 years’ experience and professional research team in various cities over the world QY Research focuses on management consulting, database and seminar services, IPO consulting, industry chain research and customized research to help our clients in providing non-linear revenue model and make them successful. We are Globally recognized for our expansive portfolio of services, good corporate citizenship, and our strong commitment to sustainability. Up to now, we have cooperated with more than 60,000 clients across five continents. Let’s work closely with you and build a bold and better future.

QYResearch is a world-renowned large-scale consulting company. The industry covers various high-tech industry chain market segments, spanning the semiconductor industry chain (semiconductor equipment and parts, semiconductor materials, ICs, Foundry, packaging and testing, discrete devices, sensors, optoelectronic devices), photovoltaic industry chain (equipment, cells, modules, auxiliary material brackets, inverters, power station terminals), new energy automobile industry chain (batteries and materials, auto parts, batteries, motors, electronic control, automotive semiconductors, etc.), communication industry chain (communication system equipment, terminal equipment, electronic components, RF front-end, optical modules, 4G/5G/6G, broadband, IoT, digital economy, AI), advanced materials industry Chain (metal materials, polymer materials, ceramic materials, nano materials, etc.), machinery manufacturing industry chain (CNC machine tools, construction machinery, electrical machinery, 3C automation, industrial robots, lasers, industrial control, drones), food, beverages and pharmaceuticals, medical equipment, agriculture, etc.

About Us:
QYResearch founded in California, USA in 2007, which is a leading global market research and consulting company. Our primary business include market research reports, custom reports, commissioned research, IPO consultancy, business plans, etc. With over 18 years of experience and a dedicated research team, we are well placed to provide useful information and data for your business, and we have established offices in 7 countries (include United States, Germany, Switzerland, Japan, Korea, China and India) and business partners in over 30 countries. We have provided industrial information services to more than 60,000 companies in over the world.

Contact Us:
If you have any queries regarding this report or if you would like further information, please contact us:
QY Research Inc.
Add: 17890 Castleton Street Suite 369 City of Industry CA 91748 United States
EN: https://www.qyresearch.com
Email: global@qyresearch.com
Tel: 001-626-842-1666(US)
JP: https://www.qyresearch.co.jp

カテゴリー: 未分類 | 投稿者huangsisi 12:05 | コメントをどうぞ

Polyester-based TPU Film Research:compound annual growth rate (CAGR) of 8.1% in the next few years

Polyester-based TPU Film Market Summary

According to the latest report “Global Polyester-based TPU Film Market Report 2025-2031″ by the QYResearch research team, the global Polyester-based TPU Film market size is expected to reach US$2.319 billion in 2031, with a compound annual growth rate (CAGR) of 8.1% in the next few years.

Polyester-based TPU Film is a high-performance film material made primarily from polyester-type thermoplastic polyurethane (TPU) through extrusion, casting, or calendering processes. It possesses excellent elasticity, abrasion resistance, tear resistance, and low-temperature resistance, while also exhibiting good moisture permeability and waterproofing. This film combines the mechanical strength of polyester with the flexibility of TPU, maintaining stable dimensional and mechanical properties over long-term use. It is widely used in sportswear, protective equipment, medical devices, outdoor products, electronic products, and industrial membrane materials. Polyester-based TPU Film can be laminated with fabrics, non-woven fabrics, plastic films, and other materials through coating, lamination, or heat sealing to achieve functions such as waterproofing, breathability, impact protection, and enhanced durability, meeting various functional and environmental performance requirements. Its high transparency and processing adaptability make it an important choice in the high-end functional membrane material market.


This report profiles key players of Polyester-based TPU Film such as Covestro、Permali、Jiaxing Nanxiong Polymer Co.,Ltd.、Leo New material、Plastic Film Corp.、YANTAI LINGHUA、HUAFENG、POSTRO VIETNAM、Lubrizol、Shandong Beiqiao New Material Technology Co.,Ltd.、Dunmore、Huafon Group、3F-TECH.

The Polyester-based TPU Film market is currently in a phase of structural growth, driven primarily by increasing demand for high-wear-resistance, high-transparency, and environmentally friendly materials in sectors such as new energy vehicle paint protection films, functional clothing composites, and consumer electronics protection. Compared to PVC and traditional elastomers, its advantages in oil resistance, mechanical strength, and sustainability are making its substitution trend increasingly clear. The high-end market is still dominated by international manufacturers with advantages in formulation and precision casting processes, but Asian suppliers, particularly Chinese suppliers, are accelerating their expansion in the mid-range and customized product sectors, driving price stratification. Short-term demand is closely related to the automotive aftermarket, outdoor sports products, and consumer electronics cycles, while the medium to long term will benefit from the growth in new energy vehicle ownership, upgrades in medical protection, and green material policies. Solvent-free production, recyclable TPU, and bio-based raw materials are becoming important technological directions. The industry also faces challenges such as fluctuating prices of raw materials MDI and polyols, homogeneous competition, and increasing customer demands for quality stability. In the future, manufacturers with advanced transparent film technology, composite processing capabilities, and stable supply chains are more likely to achieve sustained growth in niche markets such as automotive protective films and high-end industrial composite materials.

The main drivers of the development of Polyester-based TPU Film include increasing end-application demand, outstanding performance advantages, and the promotion of environmental regulations and sustainable development trends.

Firstly, the increasing demand for lightweight, abrasion-resistant, tear-resistant, and waterproof/breathable materials in fields such as sportswear, outdoor protective equipment, medical devices, and electronic products has directly driven the market expansion of high-performance films.

Secondly, Polyester-based TPU Film combines the high strength of polyester with the excellent flexibility of TPU, exhibiting outstanding performance in abrasion resistance, low-temperature resistance, elasticity, and processing adaptability, giving it a significant advantage among functional materials.

Simultaneously, the increasing global focus on environmentally friendly and sustainable materials has driven increased demand for recyclable, low-volatile, and low-hazardous substance content Polyester-based TPU Films.

Furthermore, improvements in manufacturing processes and the development of film lamination technologies have also improved product performance and application flexibility, enhancing the adoption willingness of downstream industries.

Overall, increasing end-application demand, performance advantages, and environmental regulations are the core factors driving the continued development of the Polyester-based TPU Film market.

The Polyester-based TPU Film industry chain is a vertically integrated system of division of labor and value transmission, starting with petroleum derivatives, proceeding through midstream polymer synthesis and precision manufacturing, and ultimately serving diversified end-user markets. Each link in the chain is closely interconnected. The upstream raw material supply pattern directly affects midstream production costs and capacity layout, while the expansion and upgrading of downstream application areas are the core engines driving the growth of the entire industry chain.

The upstream of the industry chain mainly consists of basic chemical raw materials, which are the source determining the performance and cost of TPU.

The production of polyester-based TPU is highly dependent on key chemical intermediates such as MDI (diphenylmethane diisocyanate), polyols, BDO (1,4-butanediol), and adipic acid. These raw materials are all derived from the processing and derivation of basic energy sources such as coal and crude oil. This segment exhibits typical capital-intensive and technology-intensive characteristics.

The midstream of the industry chain encompasses two core links: TPU resin synthesis and film precision manufacturing.

In the resin synthesis stage, companies use upstream raw materials such as MDI and polyols to generate polyester-type TPU particles through polymerization reactions. In the film manufacturing stage, companies purchase TPU particles and process them into functional films through processes such as dehumidification and drying, melt extrusion, casting, and cooling. This process is often accompanied by precision coating, lamination (such as PET release film), and post-processing. The focus of competition in this segment is shifting from simple capacity expansion to process precision control (such as 0.05-0.5mm thickness tolerance) and the development of special functions (such as breathability, flame retardancy, and easy solubility).

Downstream applications in the industry chain are showing a diversified, specialized, and high-end trend.

Polyester-based TPU Films, with their advantages of high abrasion resistance, high tensile strength (up to 70MPa), oil resistance, and good airtightness, have formed several niche markets worth tens of billions of yuan. The automotive sector is one of its core applications, encompassing interior upholstery, seat airbags, cable sheathing, and emerging smart surface materials. Footwear and sportswear are its traditional strong markets, with mature industrial chains already established in areas such as athletic shoe cushioning, waterproof and breathable composite fabrics, and trademark decoration. The electronics and medical sectors are the fastest-growing segments; the former is used in flexible circuit board cover films and mobile phone buttons, while the latter benefits from the biocompatibility of TPU, with its penetration rate continuously increasing in areas such as medical dressings and surgical drapes. Furthermore, high-end industrial sectors such as aerospace, construction, and energy are becoming new growth drivers, placing higher demands on hydrolysis resistance and weather resistance.

In summary, the Polyester-based TPU Film industrial chain has formed a complete closed loop from “basic chemical raw materials—TPU resin/particles—precision film manufacturing—vertical industry applications.” Currently, this industrial chain is undergoing three profound transformations: the upstream is accelerating its transformation towards bio-based raw materials and low-carbon processes; the midstream is improving efficiency and yield through intelligent production lines (such as double-layer co-extrusion technology); and the downstream is continuously extending into “blue ocean” markets such as wearable flexible electronics and environmentally friendly packaging. In this process, leading enterprises with upstream raw material bargaining power, midstream precision manufacturing capabilities, and downstream customized solution integration capabilities are building increasingly strong competitive barriers.

The global Polyester-based TPU Film market exhibits a distinct “pyramid” tiered competitive landscape. At the top are global giants possessing core technologies for upstream raw material polymerization. They have built difficult-to-replicate cost and quality control barriers by establishing a vertically integrated supply chain from MDI/polyols to TPU particles to functional films. The focus of competition among these leading companies has shifted from “capacity expansion” to “certification barriers” and “formulation patents”—particularly in high-barrier areas such as ISO 10993 medical certification, automotive interior VOC control, and UL94 flame retardant standards. The top five manufacturers are estimated to hold over 60% of the high-end market share for Polyester-based TPU Films globally.

The second tier comprises regional leading Chinese companies with specialized and innovative characteristics. Their core strengths lie in vertical integration capabilities and customized services for specific market segments. These companies share a common strategy: avoiding the fierce competition in standardized bulk product categories and shifting towards niche markets with long certification cycles, rapid technological iteration, but high profits.

The third tier comprises numerous small and medium-sized mainland manufacturers primarily producing low-priced, bulk-volume products, trapped in a “bargain-priced” predicament. Due to the relatively low technological barriers in the low-end market for polyester TPU films, many manufacturers concentrate on areas such as shoe linings, ordinary bags, and general waterproof fabrics, resulting in severe product homogenization. This tier is facing pressure from both upstream and downstream sectors: upstream raw material costs fluctuate wildly, while downstream brand customers continue to concentrate on first- and second-tier suppliers with system certifications and stable batch delivery capabilities.

In summary, the competitive landscape of Polyester-based TPU Films has evolved into a clear pattern of “tiered competition and differentiated competition.” International chemical giants leverage their full-industry-chain advantages and technological patents to maintain their position in ultra-high-end sectors such as medical and aerospace; leading Chinese companies rely on vertical integration, agile R&D, and high-level certifications to directly compete with international brands in high-value-added sectors such as automotive PPF, medical protective films, and high-end architectural films; while the vast majority of small and medium-sized manufacturers are still struggling to survive between scale and price, facing immense pressure to transform and upgrade.

In the future, as the industrialization of next-generation application scenarios such as flexible skin for humanoid robots, solid-state battery encapsulation films, and bio-based biodegradable films approaches, companies that can bridge the triple gap of “material synthesis – precision processing – terminal certification” will become the key force in reshaping the new round of competition.


About QYResearch

QYResearch founded in California, USA in 2007.It is a leading global market research and consulting company. With over 17 years’ experience and professional research team in various cities over the world QY Research focuses on management consulting, database and seminar services, IPO consulting (data is widely cited in prospectuses, annual reports and presentations), industry chain research and customized research to help our clients in providing non-linear revenue model and make them successful. We are globally recognized for our expansive portfolio of services, good corporate citizenship, and our strong commitment to sustainability. Up to now, we have cooperated with more than 60,000 clients across five continents. Let’s work closely with you and build a bold and better future.

QYResearch is a world-renowned large-scale consulting company. The industry covers various high-tech industry chain market segments, spanning the semiconductor industry chain (semiconductor equipment and parts, semiconductor materials, ICs, Foundry, packaging and testing, discrete devices, sensors, optoelectronic devices), photovoltaic industry chain (equipment, cells, modules, auxiliary material brackets, inverters, power station terminals), new energy automobile industry chain (batteries and materials, auto parts, batteries, motors, electronic control, automotive semiconductors, etc.), communication industry chain (communication system equipment, terminal equipment, electronic components, RF front-end, optical modules, 4G/5G/6G, broadband, IoT, digital economy, AI), advanced materials industry Chain (metal materials, polymer materials, ceramic materials, nano materials, etc.), machinery manufacturing industry chain (CNC machine tools, construction machinery, electrical machinery, 3C automation, industrial robots, lasers, industrial control, drones), food, beverages and pharmaceuticals, medical equipment, agriculture, etc.


About Us:
QYResearch founded in California, USA in 2007, which is a leading global market research and consulting company. Our primary business include market research reports, custom reports, commissioned research, IPO consultancy, business plans, etc. With over 18 years of experience and a dedicated research team, we are well placed to provide useful information and data for your business, and we have established offices in 7 countries (include United States, Germany, Switzerland, Japan, Korea, China and India) and business partners in over 30 countries. We have provided industrial information services to more than 60,000 companies in over the world.

Contact Us:
If you have any queries regarding this report or if you would like further information, please contact us:
QY Research Inc.
Add: 17890 Castleton Street Suite 369 City of Industry CA 91748 United States
EN: https://www.qyresearch.com
Email: global@qyresearch.com
Tel: 001-626-842-1666(US)
JP: https://www.qyresearch.co.jp

カテゴリー: 未分類 | 投稿者huangsisi 12:02 | コメントをどうぞ

Cosmetic & Therapeutic Nail Treatments: Strategic Forecast of the Nail Beauty Products Industry

Global Leading Market Research Publisher Global Info Research announces the release of its latest report *“Nail Beauty Products – Global Market Share and Ranking, Overall Sales and Demand Forecast 2026-2032”.* Based on current situation and impact historical analysis (2021-2025) and forecast calculations (2026-2032), this report provides a comprehensive analysis of the global Nail Beauty Products market, including market size, share, demand, industry development status, and forecasts for the next few years.

For consumers and salon professionals, nail beauty products are essential for cosmetic and therapeutic care of fingernails and toenails. These include nail polish (color, base coat, top coat), nail polish remover (acetone, non-acetone), nail extensions (acrylics, gels, tips), manicure products (cuticle care, files, buffers, tools), and others. Products help clean, shape, strengthen, and decorate nails, contributing to personal grooming and appearance. In 2024, global production reached approximately 518 million units, with an average price of US$30 per unit. The market is driven by rising disposable income, social media influence (nail art trends, Instagram, TikTok), salon industry growth, and the shift to professional-quality at-home manicures (post-pandemic). Nail polish dominates (40% of market), followed by manicure products (25%), nail polish remover (15%), extensions (10%), others (10%). Gel polish (UV/LED cured) fast-growing (12% CAGR). Acrylics, dip powder alternatives. Clean beauty (10-free, vegan, cruelty-free). Women primary consumers (90%), men grooming expanding.

【Get a free sample PDF of this report (Including Full TOC, List of Tables & Figures, Chart)】
https://www.qyresearch.com/reports/6094594/nail-beauty-products

Market Valuation & Growth Trajectory (2026-2032)

The global market for Nail Beauty Products was estimated to be worth approximately US18.0billionin2025∗∗andisprojectedtoreach∗∗US18.0billionin2025∗∗andisprojectedtoreach∗∗US 29.8 billion by 2032, growing at a CAGR of 7.5% from 2026 to 2032 (Source: Global Info Research, 2026 revision). In 2024, global production reached approximately 518 million units, with an average price of US30perunit.Thisstronggrowthreflectsincreasingfrequencyofnailgrooming(weeklytouch‑ups),seasonalcollections(spring,summer,fall,holiday),andpremiumization(30perunit.Thisstronggrowthreflectsincreasingfrequencyofnailgrooming(weeklytouch‑ups),seasonalcollections(spring,summer,fall,holiday),andpremiumization(15-30 per bottle). Key regions: Asia‑Pacific (35% of sales, China, Japan, South Korea), North America (30%), Europe (25%), Rest of World (10%). Average price: drugstore 5−10,premium5−10,premium10-20, luxury $20-40. Nail polish formulations: regular (air‑dry), gel (UV/LED cure, long‑wear 2‑3 weeks), quick‑dry, breathable. Acetone remover (effective) vs non‑acetone (gentle). Nail extensions: acrylic (liquid monomer + powder), UV gel (soak‑off), dip powder (glue + colored powder). Manicure tools: cuticle pusher, nipper, scissors, clippers, files (glass, emery board), buffers. Nail art: stickers, stamps, foils, rhinestones, glitter. Individual (at‑home) segment 70% of sales, Commercial (salons) 30%. Salons recovering post‑COVID, home manicures sustained.

Exclusive Observer Insights (Q1-Q2 2026): Key market trends include: (1) gel polish (long‑wear, high gloss) professional and home; (2) dip powder nails (stronger than gel, no UV lamp); (3) press‑on nails (instant, reusable, stylish); (4) nail strengthening treatments (hardener, growth serum); (5) eco‑friendly (recyclable packaging, vegan, cruelty‑free, 10‑free). Nail polish removal: acetone (quick, drying), non‑acetone (gentle, slower). Gel removal: soak in acetone (10-15 min), buff. Nail extension removal: soak (gel), file (acrylic). Professional salon segment: gel polish application (30−50),acrylicfullset(30−50),acrylicfullset(40-70), dip powder ($40-60). At‑home: drugstore brands (Sally Hansen, Revlon), premium (OPI, Essie, CND, Gelish), luxury (Chanel, Dior, YSL, Hermès). Key players: Coty (OPI, Sally Hansen, Rimmel), Revlon, L’Oréal (Essie), Estée Lauder (MAC, Clinique). Clean beauty: 5-free, 7-free, 10‑free (no toluene, DBP, formaldehyde, formaldehyde resin, camphor, ethyl tosylamide, xylene, TPHP, parabens, fragrance allergens). Nail polish formulation improvements: faster drying, longer wear, chip resistance. Breathable polish allows oxygen to nail bed (healthier). Nail strengthener: biotin, keratin, calcium, horsetail extract.

Key Market Segments: By Type, Application, and Formulation

Major players include Coty Inc (US, OPI, Sally Hansen), Revlon Inc., The Estée Lauder Companies, L’Oréal Group (Essie), Kiara Sky Professional Nails, ORLY International Inc., KISS Products, Inc., Flormar, Sally Hansen (Coty), Young Nails Inc., Nail Systems International, Dashing Diva, LeChat Nails, Bio Sculpture Gel, International Nail Manufacturers, Deborah Lippmann, Barry M Cosmetics, Makartt Inc, Guangzhou Missgel Co., Ltd, and Shenzhen MRB Cosmetics Co., Ltd.

Segment by Type

  • Nail Polish – Largest segment (approx. 40% of market). Color, base/top coat, gel. High repeat purchase.
  • Manicure Products – Second (approx. 25% of market). Files, buffers, cuticle tools, strengthener.
  • Nail Polish Remover – Third (approx. 15% of market). Acetone, non‑acetone, gel remover.
  • Nail Extensions – Fourth (approx. 10% of market). Acrylic, gel, dip powder, tips, press‑on.
  • Others – Nail art, drying spray, cuticle oil. Approx. 10% of market.

Segment by Application

  • Individual – Larger segment (approx. 70% of sales). At‑home use. Drugstore, mass, premium.
  • Commercial – Second (approx. 30% of sales). Salons, nail bars. Professional brands.

Industry Layering: Nail Product Types Comparison

Product Type Durability Application Removal Price (retail) Market Share
Regular polish 3-7 days Air‑dry Acetone $5-15 40%
Gel polish 14-21 days UV/LED cure Acetone soak $10-20 20% (growing)
Dip powder 21-28 days Glue + powder Acetone soak $15-30 10%
Acrylic extensions 21-28 days Liquid + powder File (mechanical) $20-50 10%
Press‑on nails 7-14 days Adhesive sticker Peel off $8-20 5% (growing)

Technological Challenges & Market Drivers (2025-2026)

  1. UV lamp safety – Gel polish UV/LED exposure (skin cancer risk). Use gloves, sunscreen. Low‑intensity LEDs.
  2. Acetone drying – Prolonged use damages nails, cuticles. Moisturize after.
  3. Ingredient regulation – EU bans certain ingredients (toluene, DBP, formaldehyde). US FDA less strict.
  4. Nail damage – Over‑buffing, improper removal (peeling gel). Nail strengtheners.

Real-World User Case Study (2025-2026 Data):

A nail salon chain (500 locations, US) switched from regular polish to gel polish (CND Shellac) for all manicures. Baseline (regular polish): durability 3-7 days, touch‑ups every 3 days. After gel (2025):

  • Durability: 14 days (no chips). Client satisfaction high.
  • Revenue: regular 20,gel20,gel35 (+15).500salonsx10clients/dayx300daysx15).500salonsx10clients/dayx300daysx15 = $22.5M incremental revenue.
  • Cost: gel polish 10/bottle(vs10/bottle(vs5 regular). Lamp $100 each.
  • Result: Salons converted to gel exclusively.

Exclusive Industry Outlook (2027–2032):

Three strategic trajectories by 2028:

  1. Premium gel/dip tier (OPI, Essie, CND, Gelish, Kiara Sky, Young Nails, LeChat, Bio Sculpture, Deborah Lippmann) — 8-9% CAGR. $10-30.
  2. Mass retail tier (Sally Hansen, Revlon, ORLY, KISS, Flormar, Makartt) — 6-7% CAGR. $5-15.
  3. Clean beauty tier (10‑free, vegan, cruelty‑free) — 10-12% CAGR (fastest-growing). $12-25.

Contact Us:
If you have any queries regarding this report or if you would like further information, please contact us:
Global Info Research
Add: 17890 Castleton Street Suite 369 City of Industry CA 91748 United States
EN: https://www.qyresearch.com
E-mail: global@qyresearch.com
Tel: 001-626-842-1666(US)
JP: https://www.qyresearch.co.jp


カテゴリー: 未分類 | 投稿者huangsisi 11:54 | コメントをどうぞ

Programmable Calculator: Graphing and Non-Graphing Models for STEM Education and Engineering (2026-2032)

Global Leading Market Research Publisher Global Info Research announces the release of its latest report *“Programmable Calculator – Global Market Share and Ranking, Overall Sales and Demand Forecast 2026-2032”.* Based on current situation and impact historical analysis (2021-2025) and forecast calculations (2026-2032), this report provides a comprehensive analysis of the global Programmable Calculator market, including market size, share, demand, industry development status, and forecasts for the next few years.

For students, engineers, scientists, and finance professionals, performing repetitive or complex calculations manually is time‑consuming and error‑prone. A programmable calculator is an advanced type of calculator that allows users to create and store custom programs using built‑in languages (BASIC, keystroke scripting). Unlike basic or scientific calculators, programmable models automate tasks, perform multi‑step computations, and execute user‑defined functions. They are widely used in engineering, mathematics, physics, finance, and computer science education. In 2024, global shipments exceeded 12 million units, with an average factory price of US$13.3 per unit. The market is driven by STEM education growth, standardized testing requirements (AP, SAT, IB), and professional demand. North America is the largest market. Texas Instruments dominates (TI‑84 series). Asia‑Pacific is the fastest‑growing, driven by China, Japan, South Korea. Europe is stable.

【Get a free sample PDF of this report (Including Full TOC, List of Tables & Figures, Chart)】
https://www.qyresearch.com/reports/6094591/programmable-calculator

Market Valuation & Growth Trajectory (2026-2032)

The global market for Programmable Calculator was estimated to be worth approximately US265millionin2025∗∗andisprojectedtoreach∗∗US265millionin2025∗∗andisprojectedtoreach∗∗US 366 million by 2032, growing at a CAGR of 4.7% from 2026 to 2032 (Source: Global Info Research, 2026 revision). In 2024, global shipments exceeded 12 million units, with an average factory price of US13.3perunit.Thismaturemarketgrowthreflectsreplacementcycles(3‑5years),standardizedtestrequirements,andprofessionalengineeringdemand.Keyregions:NorthAmerica(4013.3perunit.Thismaturemarketgrowthreflectsreplacementcycles(3‑5years),standardizedtestrequirements,andprofessionalengineeringdemand.Keyregions:NorthAmerica(4015-40, graphing 60−150,high‑end60−150,high‑end150-300. Graphing calculators (TI-84, Casio fx-9750GIII) dominate (60% of market). Texas Instruments (TI) US market share 80% (TI‑84 Plus CE, TI‑Nspire). Casio leads Asia (fx-9860GIII, fx-CG50). Sharp (EL-9900). HP (Prime). Graphing calculators have large screen (64×128 to 320×240 pixels). Programmable languages: TI-BASIC, Casio BASIC, HP PPL, Python (recent). Computer Algebra System (CAS) for symbolic math (TI‑Nspire CAS, HP Prime). Memory: 100KB-4MB RAM, Flash ROM. USB connectivity (computer software). Approved for standardized tests: AP Calculus, AP Statistics, SAT, ACT, IB, GCSE, A‑level. Non‑CAS models allowed (some exams restrict CAS). Battery: AAA (replaceable), rechargeable Li‑ion (TI‑Nspire). Education segment 80% of sales (high school, college). Offices/Engineering 20% (professional). Replacement cycles: student upgrades (graphing→advanced). TI‑84 series introduced 2004, still dominant.

Exclusive Observer Insights (Q1-Q2 2026): Key market trends include: (1) Python programming onboard (TI‑84 Plus CE Python, Casio fx‑9750GIII, HP Prime); (2) color screens (TI‑84 Plus CE, Casio fx-CG50); (3) rechargeable batteries (USB‑C); (4) wireless connectivity (classroom, data sharing); (5) exam modes (restrict CAS, memory). Graphing calculators remain essential in STEM despite tablets (physical keyboard, durability, exam security, battery life). TI‑84 Plus CE: color LCD, 150KB RAM, 3MB Flash, USB, battery 140 hours. Price 120−150.Casiofx−9750GIII:monochrome,Python,120−150.Casiofx−9750GIII:monochrome,Python,50-60. Casio fx-CG50: color, 80−100.HPPrime:touchscreen,CAS,80−100.HPPrime:touchscreen,CAS,130-150. TI‑Nspire CX II CAS: Computer Algebra System, $150-180. Basic programmable: TI‑30X Pro, Casio fx-991EX (non‑graphing). Teacher software (TI‑SmartView, Casio ClassPad). Standardized test policies: College Board (AP) allows graphing calculators with restrictions (no CAS, no QWERTY keyboard). ACT, SAT allow specific models. IB requires graphic display calculator (GDC). Exam mode disables CAS, clears memory. Security: TI exam lock.

Key Market Segments: By Type, Application, and Region

Major players include Casio (Japan), Texas Instruments (US, market leader), Sharp (Japan), HP (US), and Sunway (China).

Segment by Type

  • Graphing Programmable Calculators – Largest segment (approx. 60% of market). TI‑84, Casio fx-CG50, HP Prime. Higher price.
  • Basic Programmable Calculators – Second (approx. 30% of market). TI‑30X Pro, Casio fx-991EX. Lower price.
  • Others – Financial programmable, scientific programmable. Approx. 10% of market.

Segment by Application

  • Education – Largest segment (approx. 80% of sales). High school (AP, IB), college (STEM). Replacement each student.
  • Offices and Engineering – Second (approx. 20% of sales). Professional use.

Industry Layering: Programmable Calculator Types

Type Screen CAS Programming Price Memory Battery Market Share
Basic programmable Monochrome (2 lines) No Keystroke $15-40 low AAA 30%
Graphing (monochrome) 64×128 No BASIC, Python $50-80 64KB-1MB AAA 30%
Graphing (color) 320×240 Optional BASIC, Python $100-150 100KB-3MB Li‑ion 25%
Graphing + CAS 320×240 Yes BASIC, Python, PPL $150-300 256MB+ Li‑ion 15%

Technological Challenges & Market Drivers (2025-2026)

  1. Tablet competition – iPads, Chromebooks with calculator apps. Exam security (cheating), physical keyboard, durability limit tablets.
  2. Exam restrictions – CAS models banned from some tests. Non‑CAS required.
  3. TI dominance – School curricula (textbooks, teacher training) align with TI‑84. Switching costs high.
  4. Price sensitivity – Low‑cost basic programmable (Casio fx-991EX) competes with smartphone apps.

Real-World User Case Study (2025-2026 Data):

A US high school (2,000 students) replaced TI‑83 Plus (monochrome, non‑color, 90)withTI‑84PlusCE(color,rechargeable,90)withTI‑84PlusCE(color,rechargeable,120). Baseline (TI‑83 Plus): battery drain (AAA). Lower engagement. After TI‑84 Plus CE (2025):

  • Cost: 2,000 x 120=120=240,000. Lab packs (10 units) 1,100each.(TI‑831,100each.(TI‑8380 each, 160k).Incremental160k).Incremental80k.
  • Features: color screen, rechargeable, Python. Student engagement up.
  • AP Calculus pass rate: +5% (better visualization).
  • Result: District standardized on TI‑84 Plus CE.

Exclusive Industry Outlook (2027–2032):

Three strategic trajectories by 2028:

  1. TI ecosystem tier (Texas Instruments) — 4-5% CAGR. $60-200. Dominant US, NA.
  2. Casio/Sharp value tier (Casio, Sharp) — 5-6% CAGR. $30-120. Asia, Europe.
  3. HP / Specialty tier (HP) — 3-4% CAGR. $100-200. Engineering, finance.

Contact Us:
If you have any queries regarding this report or if you would like further information, please contact us:
Global Info Research
Add: 17890 Castleton Street Suite 369 City of Industry CA 91748 United States
EN: https://www.qyresearch.com
E-mail: global@qyresearch.com
Tel: 001-626-842-1666(US)
JP: https://www.qyresearch.co.jp

カテゴリー: 未分類 | 投稿者huangsisi 11:53 | コメントをどうぞ

Invisible Containment & Pet Safety: Strategic Forecast of the Pet Radio Fence Industry

Global Leading Market Research Publisher Global Info Research announces the release of its latest report *“Pet Radio Fence – Global Market Share and Ranking, Overall Sales and Demand Forecast 2026-2032”.* Based on current situation and impact historical analysis (2021-2025) and forecast calculations (2026-2032), this report provides a comprehensive analysis of the global Pet Radio Fence market, including market size, share, demand, industry development status, and forecasts for the next few years.

For pet owners, traditional physical fences are expensive, time-consuming to install, and may not be permitted in some communities (HOA restrictions). A pet radio fence is an electronic system that uses radio frequency (RF) or GPS technology to set a virtual boundary. It consists of a base station transmitter and a receiver collar worn by the pet. When the pet approaches the preset boundary, the receiver emits a warning sound, vibration, or safe static correction, training the pet to stay within a defined area without a physical fence. In 2024, global production reached approximately 3.2 million units, with an average price of US$285 per unit. The market is driven by pet ownership growth, urbanization (small yards, HOAs), and demand for wireless, portable containment solutions. Types include RF (buried wire), GPS (satellite, no wire), and hybrid (RF+GPS). Suitable for dogs (most common) and cats.

【Get a free sample PDF of this report (Including Full TOC, List of Tables & Figures, Chart)】
https://www.qyresearch.com/reports/6094545/pet-radio-fence

Market Valuation & Growth Trajectory (2026-2032)

The global market for Pet Radio Fence was estimated to be worth approximately US966millionin2025∗∗andisprojectedtoreach∗∗US966millionin2025∗∗andisprojectedtoreach∗∗US 1.50 billion by 2032, growing at a CAGR of 6.5% from 2026 to 2032 (Source: Global Info Research, 2026 revision). In 2024, global production reached approximately 3.2 million units, with an average price of US285perunit.Thisgrowthreflectsincreasingpethumanization,risingpetownership(dogs900M,cats600Mglobally),andreplacementcycles(collarbatteries,transmitterupgrades).Keyregions:NorthAmerica(50285perunit.Thisgrowthreflectsincreasingpethumanization,risingpetownership(dogs900M,cats600Mglobally),andreplacementcycles(collarbatteries,transmitterupgrades).Keyregions:NorthAmerica(50150-400, GPS (wireless) 300−800,hybrid300−800,hybrid500-1,200. RF fence requires installing boundary wire (buried or above ground) around perimeter (up to 5 acres). GPS fence uses satellite (no wire) – portable, works anywhere, requires cellular subscription ($5-15/month). Hybrid combines RF for home base + GPS for remote containment (camping, travel). Correction levels: warning tone, vibration, static stimulation (adjustable 1-10). Range: RF up to 1000ft wire length (5 acres). GPS unlimited (satellite coverage). Battery life: RF collar 1-3 months (replaceable), GPS 1-2 weeks (rechargeable). Collar waterproof (IP67). Training period: 2-4 weeks.

Exclusive Observer Insights (Q1-Q2 2026): Key market trends include: (1) GPS electronic fence (wireless, portable) growing faster than RF; (2) hybrid (RF+GPS) for home + travel; (3) smart collars with GPS tracking, activity monitoring, escape alerts; (4) no-shock containment (vibration, tone only – humane); (5) multiple pet support (unlimited collars). RF fence advantages: no subscription, reliable, lower cost. Disadvantages: buried wire installation (labor), wire breaks (digging, lawn mower). GPS fence advantages: portable, no wire, works anywhere (no boundary installation). Disadvantages: cellular subscription, GPS signal loss (trees, buildings), battery life shorter. Hybrid best of both worlds. Tractive GPS fence (virtual boundary via app). Fi Smart Collar (GPS tracking + fence). Garmin, SportDOG (professional). Training: flags mark boundary, pet learns warning zone. Static correction level (4-6 typical). Safety: automatic shut-off if pet leaves containment (no continuous shock). Waterproof collar (swimming). Suitable for small dogs (5 lb+) to large breeds. Cat fences exist (smaller collars). FCC certified (US). CE (Europe).

Key Market Segments: By Type, Application, and Technology

Major players include Halo Collar (US, GPS, Cesar Millan), SpotOn Fence (US, GPS), PetSafe (US, RF leader), TTPet, My Pet Command, Western Pet Products, Invirox, Garmin (US, GPS), SportDOG (US), Fi Smart Dog Collar (US, GPS tracking), Tractive (Austria, GPS tracking), DogTrace, PETKIT (China), Invisible Fence (US, RF, professional installed), and Radio Pet.

Segment by Type

  • Radio Fence (RF/Wire) – Largest segment (approx. 50% of units). Buried boundary wire. Lower cost, no subscription.
  • GPS Electronic Fence – Fastest-growing (approx. 35% of units, CAGR 9%). Wireless, portable, requires subscription.
  • Hybrid (RF+GPS) – Premium segment (approx. 15% of units). Home + travel. Higher cost.

Segment by Application

  • Dog – Largest segment (approx. 95% of units). Most common for pet containment.
  • Cat – Smaller segment (approx. 5% of units). Cat-specific collars (lighter, breakaway).

Industry Layering: Pet Radio Fence Types

Feature RF (Buried Wire) GPS (Wireless) Hybrid (RF+GPS)
Installation Buried wire (labor) None (app setup) Wire + app
Portability No (fixed) Yes (anywhere) Yes
Subscription No Yes ($5-15/month) Sometimes
Boundary shape Any (wire path) Circle (center point) or polygon (app) Any
Range Up to 5 acres Unlimited (GPS) 5 acres + unlimited
Battery life Collar 1-3 months 1-2 weeks (recharge) 1-2 weeks
Price $150-400 $300-800 $500-1,200
Market share 50% 35% (growing) 15%

Technological Challenges & Market Drivers (2025-2026)

  1. GPS signal loss – Trees, buildings, canyons block satellite signals (dead zones). Collars may not correct.
  2. Wire breaks (RF) – Buried wire cut by shovel, roots, rodents, mower. Locate and splice (signal generator).
  3. Pet training – Requires owner commitment (2-4 weeks). Improper training leads to escape. Professional training optional.
  4. Static correction concern – Humane groups oppose shock collars (pain). Vibration-only, tone alternatives.

Real-World User Case Study (2025-2026 Data):

A suburban homeowner (1/2 acre, HOA prohibits physical fence, dog (Labrador, escape artist) adopted GPS fence (SpotOn, 600).Baseline(nofence):dogescapedyard(neighbors,traffic)5x/year,animalcontrolfines600).Baseline(nofence):dogescapedyard(neighbors,traffic)5x/year,animalcontrolfines200 each. After GPS fence (2025):

  • Fence cost: $600 one-time. No wire installation.
  • Subscription: $0 (SpotOn, no monthly fee).
  • Escapes: 0 in 12 months. Fines saved $1,000.
  • Training: 3 weeks, dog learned boundary.
  • Result: Owner satisfied, dog safe.

Exclusive Industry Outlook (2027–2032):

Three strategic trajectories by 2028:

  1. GPS premium tier (Halo, SpotOn, Garmin, Fi, Tractive) — 7-9% CAGR. $300-1,200.
  2. RF value tier (PetSafe, Invisible Fence, SportDOG, Radio Pet) — 5-6% CAGR. $150-400.
  3. Hybrid tier — 8-10% CAGR (fastest-growing). $500-1,200.

Contact Us:
If you have any queries regarding this report or if you would like further information, please contact us:
Global Info Research
Add: 17890 Castleton Street Suite 369 City of Industry CA 91748 United States
EN: https://www.qyresearch.com
E-mail: global@qyresearch.com
Tel: 001-626-842-1666(US)
JP: https://www.qyresearch.co.jp

カテゴリー: 未分類 | 投稿者huangsisi 11:52 | コメントをどうぞ

Biodegradable & Compostable Solutions: Strategic Forecast of the Sustainable Egg Packaging Industry

Global Leading Market Research Publisher Global Info Research announces the release of its latest report *“Sustainable Egg Packaging – Global Market Share and Ranking, Overall Sales and Demand Forecast 2026-2032”.* Based on current situation and impact historical analysis (2021-2025) and forecast calculations (2026-2032), this report provides a comprehensive analysis of the global Sustainable Egg Packaging market, including market size, share, demand, industry development status, and forecasts for the next few years.

For egg producers, retailers, and consumers, traditional plastic packaging (PET, EPS foam) contributes to plastic waste and environmental pollution. Sustainable egg packaging uses environmentally friendly materials (bio-based degradable materials, recycled materials) as the core, achieving efficient resource utilization, minimized carbon emissions, and zero waste growth throughout the life cycle via lightweight design, structural optimization, or circular economy models. It protects egg safety and meets transportation and display needs while complying with environmental regulations (plastic bans, compostability standards) and consumer green preferences. Materials include molded pulp (recycled paper, cardboard), starch-based (biodegradable, compostable), PLA (polylactic acid, bio-based), and recycled packaging (rPET, recycled paper). In 2024, global production reached approximately 328 million units, with an average price of US$0.15 per unit. The market is driven by EU Single-Use Plastics Directive, plastic bag bans, corporate sustainability commitments, and consumer demand for plastic-free packaging.

【Get a free sample PDF of this report (Including Full TOC, List of Tables & Figures, Chart)】
https://www.qyresearch.com/reports/6094537/sustainable-egg-packaging

Market Valuation & Growth Trajectory (2026-2032)

The global market for Sustainable Egg Packaging was estimated to be worth approximately US55.7millionin2025∗∗andisprojectedtoreach∗∗US55.7millionin2025∗∗andisprojectedtoreach∗∗US 73.8 million by 2032, growing at a CAGR of 4.1% from 2026 to 2032 (Source: Global Info Research, 2026 revision). In 2024, global production reached approximately 328 million units, with an average price of US0.15perunit.Thisgrowthreflectsincreasingplasticbans,retailermandates(plastic−freeaisles),andrecyclinginfrastructureimprovements.Keyregions:Europe(400.15perunit.Thisgrowthreflectsincreasingplasticbans,retailermandates(plastic−freeaisles),andrecyclinginfrastructureimprovements.Keyregions:Europe(400.05-0.12, starch-based 0.10−0.20,PLA0.10−0.20,PLA0.15-0.30, recycled packaging $0.08-0.18. Molded pulp (recycled paper, cardboard) most common (60% market share). Compostable packaging (home or industrial) requires certification (EN 13432, ASTM D6400). Biodegradable in soil, marine, anaerobic conditions. Circular economy: packaging made from recycled content, then recycled again (closed loop). Regulatory: EU Packaging and Packaging Waste Directive (PPWD) targets 65% recycling by 2025, 70% by 2030. Single-use plastics ban (EU 2019) includes EPS foam. France ban on plastic packaging for eggs (2021). US states (Maine, Oregon, Colorado) extended producer responsibility (EPR) laws. Corporate pledges: Walmart, Tesco, Carrefour plastic reduction.

Exclusive Observer Insights (Q1-Q2 2026): Key market trends include: (1) molded pulp (recycled newspaper, cardboard) – dominant, low cost; (2) starch-based (corn, potato) – biodegradable, compostable; (3) PLA (polylactic acid) from corn – bio-based, compostable; (4) recycled PET (rPET) – clear, recyclable; (5) reusable egg cartons (Tosca, returnable) – circular economy. Molded pulp process: waste paper pulped, molded, dried. No plastic coating (biodegradable). Compostable certification (home compostable vs industrial). Starch-based: dissolves in water (not waterproof), may not withstand refrigerated humidity. PLA: clarity similar to PET, compostable only in industrial facilities (high temperature, humidity). Recycled packaging: paper (recycled), plastic (rPET). Consumer preference: 70% prefer sustainable packaging, willing to pay premium ($0.05-0.10 per dozen). Retail application: egg cartons for grocery stores (12-egg). Distribution & transportation: bulk packs (30-144 eggs) for foodservice, bakeries.

Key Market Segments: By Type, Application, and Material

Major players include RedFroq (Germany), Tosca Ltd (US, reusable), Paperfoam (Netherlands), Huhtamaki (Finland), DS Smith (UK), TekniPlex Consumer Products (US), Ovotherm (Austria), Heracles Packaging SA (Greece), Kipster (Netherlands), Hartmann Packaging (Denmark), Cascades (Canada), Versatile Packaging (Australia), and Alzamora Group (Spain).

Segment by Type

  • Molded Pulp Packaging – Largest segment (approx. 60% of market). Recycled paper/cardboard, low cost, biodegradable.
  • Recycled Packaging – Second-largest (approx. 20% of market). rPET, recycled paper. Recyclable.
  • Starch-Based Packaging – Third (approx. 10% of market). Biodegradable, compostable. Water-sensitive.
  • PLA (Polylactic Acid) Packaging – Smallest (approx. 10% of market). Bio-based, compostable (industrial). Higher cost.

Segment by Application

  • Retail – Largest segment (approx. 75% of units). Grocery stores, supermarkets, farmers markets.
  • Distribution and Transportation – Second-largest (approx. 25% of units). Bulk packs for foodservice, bakeries, restaurants.

Industry Layering: Sustainable Egg Packaging Comparison

Material Biodegradable Compostable Recyclable Water resistant Cost per unit Market Share
Molded pulp Yes Yes (home/industrial) Yes (paper) Low $0.05-0.12 60%
Starch-based Yes Yes (industrial) No Low $0.10-0.20 10%
PLA Yes Yes (industrial) Limited Moderate $0.15-0.30 10%
Recycled paper Yes Yes (home/industrial) Yes Low $0.05-0.10 15%
rPET No No Yes High $0.08-0.18 5%

Technological Challenges & Market Drivers (2025-2026)

  1. Moisture resistance – Molded pulp, starch-based absorb moisture, weaken (refrigerator, condensation). Coatings (wax, PLA) improve but reduce compostability.
  2. Composting infrastructure – Industrial composting facilities not available everywhere. Home composting slower. Labeling confusion.
  3. Cost premium – Sustainable packaging 20-100% higher than plastic. Retailers absorb or pass to consumer.
  4. Supply chain – Recycled content availability (paper, PET). Quality variability.

Real-World User Case Study (2025-2026 Data):

A European egg packer (50 million dozen/year) switched from EPS foam cartons to molded pulp cartons (Huhtamaki, 0.10each).Baseline(EPS):cost0.10each).Baseline(EPS):cost0.08 per carton. $4M/year. After molded pulp (2025):

  • Cost: 0.10percarton(+0.10percarton(+0.02). Additional $1M/year.
  • EPS ban: EU Single-Use Plastics Directive (2021) phased out EPS. Compliance.
  • Consumer perception: 85% positive (eco-friendly). Brand loyalty increased.
  • Sales: +5% due to sustainable brand image. $2.5M incremental revenue.
  • Result: Packer converted 100% to molded pulp.

Exclusive Industry Outlook (2027–2032):

Three strategic trajectories by 2028:

  1. Molded pulp tier (Huhtamaki, DS Smith, Hartmann, Cascades, Versatile) — 4-5% CAGR. $0.05-0.15/unit.
  2. PLA/starch specialty tier (Paperfoam, TekniPlex, Alzamora) — 5-6% CAGR. $0.10-0.30/unit.
  3. Reusable tier (Tosca) — 6-7% CAGR (fastest-growing). $0.20-0.50/unit (per use amortized).

Contact Us:
If you have any queries regarding this report or if you would like further information, please contact us:
Global Info Research
Add: 17890 Castleton Street Suite 369 City of Industry CA 91748 United States
EN: https://www.qyresearch.com
E-mail: global@qyresearch.com
Tel: 001-626-842-1666(US)
JP: https://www.qyresearch.co.jp


カテゴリー: 未分類 | 投稿者huangsisi 11:52 | コメントをどうぞ

Egg Protection & Shelf Visibility: Strategic Forecast of the PET Egg Carton Industry

Global Leading Market Research Publisher Global Info Research announces the release of its latest report *“PET Egg Carton – Global Market Share and Ranking, Overall Sales and Demand Forecast 2026-2032”.* Based on current situation and impact historical analysis (2021-2025) and forecast calculations (2026-2032), this report provides a comprehensive analysis of the global PET Egg Carton market, including market size, share, demand, industry development status, and forecasts for the next few years.

For egg producers, packers, and retailers, traditional paper pulp or expanded polystyrene (EPS, foam) egg cartons have limitations: paper pulp obscures product view, absorbs moisture (weakens), and EPS is not widely recyclable. PET egg cartons are packaging containers specially designed for egg storage and transportation, made from polyethylene terephthalate (PET), an environmentally friendly, highly transparent thermoplastic plastic. They are lightweight, durable, impact-resistant, waterproof, and moisture-proof, effectively protecting eggs from external squeezing, collision, and contamination. High transparency allows consumers to visually check egg quality (cracks, cleanliness, size, color). PET is recyclable and reusable (curbside recycling programs), aligning with modern green packaging trends. In 2024, global PET egg carton production reached approximately 420 million units, with an average price of US$0.07 per unit. The market is driven by demand for premium egg packaging (organic, free-range), sustainability (plastic waste reduction, recycled content), and retail visibility (shelf appeal).

【Get a free sample PDF of this report (Including Full TOC, List of Tables & Figures, Chart)】
https://www.qyresearch.com/reports/6094516/pet-egg-carton

Market Valuation & Growth Trajectory (2026-2032)

The global market for PET Egg Carton was estimated to be worth approximately US32.2millionin2025∗∗andisprojectedtoreach∗∗US32.2millionin2025∗∗andisprojectedtoreach∗∗US 41.3 million by 2032, growing at a CAGR of 3.6% from 2026 to 2032 (Source: Global Info Research, 2026 revision). In 2024, global production reached approximately 420 million units, with an average price of US0.07perunit.Thissteadygrowthreflectsincreasingretaildemandforclearpackaging,bansonEPS(polystyrene)foaminsomeregions(EU,USstates),andrecycledPET(rPET)adoption.Keyregions:NorthAmerica(350.07perunit.Thissteadygrowthreflectsincreasingretaildemandforclearpackaging,bansonEPS(polystyrene)foaminsomeregions(EU,USstates),andrecycledPET(rPET)adoption.Keyregions:NorthAmerica(350.05-0.15 (depending on capacity, thickness). PET egg carton advantages over paper pulp: higher clarity, better moisture resistance (refrigerator), longer shelf life (eggs stay fresher), lighter weight (lower transport cost). PET vs EPS: EPS foam not recyclable in many areas (curbside), breaks into microplastics. PET recyclable (PET #1). PET also reusable (returnable systems). Egg capacity: small (6-12 eggs – retail consumer packs), medium (18-24 – family packs), large (30+ – bulk, foodservice). Material: virgin PET or rPET (recycled, 30-100%). Thickness: 0.3-0.6 mm. Clarity: high (light transmission). Egg cushioning design: molded dimples, ribs. Stackable design.

Exclusive Observer Insights (Q1-Q2 2026): Key market trends include: (1) recycled PET (rPET) content increasing (30-100%) for sustainability; (2) clear PET with anti-fog coating (prevents condensation); (3) colored PET (blue, green) for brand differentiation; (4) tamper-evident seals; (5) RFID/NFC tags for traceability. PET egg carton producers: thermoforming (sheet extrusion, vacuum forming). PET sheet 0.3-0.8 mm. Mold tooling cost 20k−100k.Productionspeed20−50cartonsperminute.Printing:labels,directprinting(inkjet,flexo).Sustainability:rPETreducescarbonfootprintvsvirginPET(50−7020k−100k.Productionspeed20−50cartonsperminute.Printing:labels,directprinting(inkjet,flexo).Sustainability:rPETreducescarbonfootprintvsvirginPET(50−700.10-0.20 per dozen.

Key Market Segments: By Type, Application, and Material

Major players include Benxo (Poland), EggTrayWorld (China), Eipack (Italy), Falcon Packaging (UK), Guangzhou Rosin Packaging (China), JHPKG (China), Kuhn Corp Print & Packaging (US), Miller Manufacturing Company (US), Ovotherm (Austria), Pactiv Evergreen (US), TekniPlex (US), Versatile Packaging (Australia), and Zhongkai Packaging Technology (China).

Segment by Type (Capacity)

  • Small Capacity (6-12 Pieces) – Largest segment (approx. 50% of units). Retail consumer packs (grocery stores, supermarkets). High volume.
  • Medium Capacity (18-24 Pieces) – Second-largest (approx. 30% of units). Family packs, club stores (Costco, Sam’s).
  • Large Capacity (30 Pieces and Above) – Smallest (approx. 20% of units). Bulk, foodservice, restaurants, bakeries.

Segment by Application (Egg Producer Type)

  • Barn Egg Producers – Largest segment (approx. 40% of units). Conventional eggs, cost-sensitive.
  • Free Range Egg Producers – Second-largest (approx. 25% of units). Premium, clear packaging.
  • Organic Egg Producers – Third (approx. 20% of units). Premium, sustainable packaging.
  • Intensive Egg Producers – Approx. 10% of units. High density.
  • Others – Pasture-raised, cage-free. Approx. 5%.

Industry Layering: PET vs Paper Pulp vs EPS Egg Cartons

Feature PET Paper Pulp EPS Foam PLA (Biodegradable)
Clarity High (transparent) Opaque Opaque Opaque
Moisture resistance Excellent Poor (absorbs) Excellent Moderate
Impact protection Good Good Excellent Good
Recyclability Yes (PET #1) Yes (paper, but wet strength) Limited (EPS not accepted) Compostable (industrial)
Reusability Yes No (single-use) No No
Cost per unit $0.05-0.15 $0.03-0.08 $0.04-0.10 $0.10-0.25
Market share (units) 25% (growing) 60% 10% (declining) 5%

Technological Challenges & Market Drivers (2025-2026)

  1. Condensation (fogging) – Cold eggs in warm, humid environment cause condensation (fogged carton). Anti-fog coating (surfactant) improves clarity.
  2. rPET quality – Recycled PET may have haze, color (yellowish), lower impact resistance. Food-grade rPET (EFSA, FDA approved).
  3. Cost vs paper pulp – PET 2-3x more expensive. Premium egg segment (organic, free range) absorbs cost.
  4. Thermoforming waste – Sheet edge trim (10-20% waste) recycled back into process. Closed loop.

Real-World User Case Study (2025-2026 Data):

A free-range egg producer (10 million dozen/year) switched from paper pulp cartons to PET clear cartons (Ovotherm, 12-egg, 0.10each).Baseline(paperpulp):0.10each).Baseline(paperpulp):0.04 per carton. Cost $400,000/year. After PET (2025):

  • Carton cost: 0.10percarton(+0.10percarton(+0.06). Additional $600,000/year.
  • Brand premium: retailer price increased 0.50/dozen.10Mx0.50/dozen.10Mx0.50 = $5M incremental revenue.
  • Sales growth: +15% (consumers prefer clear visibility). $1.5M additional.
  • Net gain: 6.5M−6.5M−600k = $5.9M.
  • Result: Producer converted 100% to PET.

Exclusive Industry Outlook (2027–2032):

Three strategic trajectories by 2028:

  1. Premium PET tier (Ovotherm, TekniPlex, Pactiv Evergreen) — 4-5% CAGR. $0.10-0.20/unit.
  2. Value PET tier (Benxo, Eipack, Falcon, Miller, Versatile, Zhongkai) — 3-4% CAGR. $0.05-0.10/unit.
  3. rPET tier (EggTrayWorld, Guangzhou Rosin, JHPKG, Kuhn) — 5-6% CAGR (fastest-growing). $0.08-0.15/unit.

Contact Us:
If you have any queries regarding this report or if you would like further information, please contact us:
Global Info Research
Add: 17890 Castleton Street Suite 369 City of Industry CA 91748 United States
EN: https://www.qyresearch.com
E-mail: global@qyresearch.com
Tel: 001-626-842-1666(US)
JP: https://www.qyresearch.co.jp

カテゴリー: 未分類 | 投稿者huangsisi 11:51 | コメントをどうぞ

Emulsification & Wetting Properties: Strategic Forecast of the Knitting Oil Emulsifier Industry

Global Leading Market Research Publisher Global Info Research announces the release of its latest report *“Knitting Oil Emulsifier – Global Market Share and Ranking, Overall Sales and Demand Forecast 2026-2032”.* Based on current situation and impact historical analysis (2021-2025) and forecast calculations (2026-2032), this report provides a comprehensive analysis of the global Knitting Oil Emulsifier market, including market size, share, demand, industry development status, and forecasts for the next few years.

For textile manufacturers and knitting mills, effective lubrication of knitting machinery requires stable oil-in-water emulsions to reduce friction, dissipate heat, and prevent static buildup. Knitting oil emulsifiers are functional additives specifically used in knitting oil systems. They improve emulsification, stability, wetting, and dispersion properties of oil in water, ensuring consistent and long-lasting lubrication, cooling, and antistatic properties during knitting. Common types include nonionic, anionic, zwitterionic, or combined surfactants, suitable for knitting various fibers (cotton, polyester, spandex, wool, nylon). In 2024, global sales reached approximately 46,000 tons, with an average selling price of US$2,100 per ton. The market is driven by global textile production growth, demand for high-quality knitted fabrics (sports apparel, activewear), and environmental regulations on wastewater treatment (emulsifiers affect effluent quality).

【Get a free sample PDF of this report (Including Full TOC, List of Tables & Figures, Chart)】
https://www.qyresearch.com/reports/6094506/knitting-oil-emulsifier

Market Valuation & Growth Trajectory (2026-2032)

The global market for Knitting Oil Emulsifier was estimated to be worth approximately US107millionin2025∗∗andisprojectedtoreach∗∗US107millionin2025∗∗andisprojectedtoreach∗∗US 155 million by 2032, growing at a CAGR of 5.4% from 2026 to 2032 (Source: Global Info Research, 2026 revision). In 2024, global sales reached approximately 46,000 tons, with an average selling price of US$2,100 per ton. This growth reflects increasing knitted fabric demand (sportswear, athleisure, underwear, socks), shift from dry knitting to wet knitting (higher quality), and need for biodegradable, low-VOC emulsifiers. Key regions: Asia-Pacific (65% of sales, China, India, Bangladesh, Vietnam – textile manufacturing hubs), Europe (15%), North America (10%), Rest of World (10%). Emulsifier concentration in knitting oil: 2-10%. Oil-to-water ratio: 1:10 to 1:50 (for emulsion). HLB (hydrophilic-lipophilic balance) value determines emulsifier type. Nonionic (HLB 10-15) most common, compatible with all fiber types. Anionic (HLB 8-12) better detergency, higher foam. Zwitterionic (amphoteric) mild, good with sensitive fibers (spandex, wool). Combined (blends) synergistic effect. Emulsifier functions: lowers interfacial tension between oil and water, stabilizes emulsion (prevents separation), improves wetting (oil spreads on fiber), enhances scourability (easily removed during fabric finishing). Knitting oil emulsifier requirement: soluble in water, good emulsification power, low foaming, biodegradable (OECD 301). Environmental regulations: REACH (EU), EPA (US). Biodegradable emulsifiers (fatty alcohol ethoxylates, sorbitan esters) replacing alkylphenol ethoxylates (APEO, endocrine disruptor). APEO-free knitting oil emulsifiers mandated by major brands (Nike, Adidas, H&M, Zara).

Exclusive Observer Insights (Q1-Q2 2026): Key market trends include: (1) nonionic emulsifiers (fatty alcohol ethoxylates, HLB 12-15) – most common; (2) combined (nonionic + anionic) for synergistic stability; (3) zwitterionic for sensitive fibers (spandex, wool); (4) low-foam emulsifiers for high-speed knitting; (5) biodegradable, APEO-free formulations. Emulsifier selection factors: fiber type (cotton hydrophilic, polyester hydrophobic), knitting speed, machine type (circular, flat, seamless), water hardness (Ca, Mg ions). Vegetable oil-based emulsifiers (renewable). Emulsion stability test (24-48 hours) – creaming, sedimentation. Droplet size (1-5 μm) stable. Knitting oil emulsifiers also impact lubrication performance (film strength, anti-wear). Over-emulsification reduces lubricity. Trade-off. Application: cotton yarn processing (hydrophilic fibers) – need good wetting. Polyester processing (hydrophobic) – need strong emulsification. Spandex (elastane) – sensitive to chemicals, requires mild emulsifier. Wool – low temperature processing, nonionic preferred.

Key Market Segments: By Type, Application, and Fiber

Major players include Hi-Tech Petrochem (India), Chempol (Poland), Huntsman (US), Eastern Petroleum Pvt. Ltd. (India), Oscar Lubricants (India), JINZHOU XINXING PETROLEUM ADDITIVE CO., LTD (China), Rundeli (China), Spectrum Cutting Solutions Pvt. Ltd. (India), Dana Lubricants (US), and Finozol (India).

Segment by Type

  • Nonionic – Largest segment (approx. 60% of market). Fatty alcohol ethoxylates, sorbitan esters. HLB 10-15. Compatible with all fibers, low foaming.
  • Anionic – Second-largest (approx. 20% of market). Petroleum sulfonates, alkylbenzene sulfonates. Good detergency, higher foam.
  • Combined – Third (approx. 15% of market). Nonionic + anionic blends. Synergistic stability.
  • Zwitterionic – Smallest (approx. 5% of market). Mild, compatible with spandex, wool.

Segment by Application

  • Cotton Yarn Processing – Largest segment (approx. 50% of market). Hydrophilic fibers, good wetting required.
  • Polyester Processing – Second-largest (approx. 30% of market). Hydrophobic fibers, strong emulsification needed.
  • Others – Spandex, wool, nylon, blends. Approx. 20% of market.

Industry Layering: Emulsifier Types Comparison

Type HLB Range Foam Compatibility Biodegradability Cost Market Share
Nonionic 10-15 Low All fibers High Medium 60%
Anionic 8-12 High Cotton (hydrophilic) Medium Low 20%
Combined 10-15 Medium All fibers High Medium 15%
Zwitterionic 10-15 Low Spandex, wool High High 5%

Technological Challenges & Market Drivers (2025-2026)

  1. APEO phase-out – Alkylphenol ethoxylates (APEO) endocrine disruptor, banned in EU (REACH). Replacement: fatty alcohol ethoxylates, sugar-based surfactants.
  2. Biogradability regulations – OECD 301 ready biodegradability (>60% in 28 days). Non-ionic (alcohol ethoxylates) degrade faster than anionic.
  3. Water hardness – Ca, Mg ions destabilize anionic emulsifiers (precipitation). Nonionic less sensitive. EDTA, chelating agents added.
  4. Low foam – High-speed knitting (1000+ rpm) causes foaming (flooding). Low-foam emulsifiers (EO-PO block copolymers).

Real-World User Case Study (2025-2026 Data):

A large Chinese textile mill (1,000 circular knitting machines) switched from APEO-based emulsifier to APEO-free nonionic emulsifier (fatty alcohol ethoxylate). Baseline (APEO): export orders rejected (APEO detection). After APEO-free (2025):

  • Compliance: passed OEKO-TEX Standard 100 (no APEO). Continues exporting to EU.
  • Cost: nonionic 2,500/tonvs2,500/tonvs1,800/ton (+39%). 46,000 tons/year? Wait mill uses 500 tons/year emulsifier. Additional cost $350k/year.
  • Benefit: recovered export sales $5M/year.
  • Result: Mill mandated APEO-free emulsifiers across all products.

Exclusive Industry Outlook (2027–2032):

Three strategic trajectories by 2028:

  1. Premium nonionic tier (Huntsman) — 6-7% CAGR. $2,500-3,500/ton.
  2. Value anionic/combined tier (Hi-Tech, Chempol, Eastern, Oscar, JINZHOU, Rundeli, Spectrum, Dana, Finozol) — 5-6% CAGR. $1,800-2,500/ton.
  3. Zwitterionic specialty tier — 5-6% CAGR. $3,000-4,000/ton.

Contact Us:
If you have any queries regarding this report or if you would like further information, please contact us:
Global Info Research
Add: 17890 Castleton Street Suite 369 City of Industry CA 91748 United States
EN: https://www.qyresearch.com
E-mail: global@qyresearch.com
Tel: 001-626-842-1666(US)
JP: https://www.qyresearch.co.jp


カテゴリー: 未分類 | 投稿者huangsisi 11:50 | コメントをどうぞ

Men’s One-Piece Swimsuit: Full Torso Coverage for High-Intensity Swimming Training and Competition (2026-2032)

Global Leading Market Research Publisher Global Info Research announces the release of its latest report *“Men’s One-Piece Swimsuit – Global Market Share and Ranking, Overall Sales and Demand Forecast 2026-2032”.* Based on current situation and impact historical analysis (2021-2025) and forecast calculations (2026-2032), this report provides a comprehensive analysis of the global Men’s One-Piece Swimsuit market, including market size, share, demand, industry development status, and forecasts for the next few years.

For competitive male swimmers, triathletes, and serious performance enthusiasts, standard swim trunks (jammers, briefs) cover the torso but leave the upper body exposed, contributing to drag. A men’s one-piece swimsuit (also known as a full-body swimsuit or kneeskin) covers the entire torso and thighs (some models extend to ankles or wrists). It is typically made of stretchy, water-resistant, quick-drying material (polyester/spandex or nylon/spandex). Unlike swim trunks, one-piece swimsuits offer more comprehensive support, muscle compression, and a streamlined shape, reducing water resistance and increasing swimming speed. They are ideal for high-intensity swimming training and competitions (elite, NCAA, Olympic). Global sales reached approximately 4.1 million units in 2024, with an average price of US$102 per unit. The market is driven by demand for performance enhancement, FINA regulations (permitted for racing), and triathlon growth.

【Get a free sample PDF of this report (Including Full TOC, List of Tables & Figures, Chart)】
https://www.qyresearch.com/reports/6094492/men-s-one-piece-swimsuit

Market Valuation & Growth Trajectory (2026-2032)

The global market for Men’s One-Piece Swimsuit was estimated to be worth approximately US464millionin2025∗∗andisprojectedtoreach∗∗US464millionin2025∗∗andisprojectedtoreach∗∗US 632 million by 2032, growing at a CAGR of 4.5% from 2026 to 2032 (Source: Global Info Research, 2026 revision). The average global price is US102,withapproximately4.1millionunitssoldworldwidein2024.Thisgrowthreflectsincreasingparticipationincompetitiveswimming,triathlon(openwater),andmastersswimming,aswellastechnologicalinnovation(fabric,compression).Keyregions:NorthAmerica(35102,withapproximately4.1millionunitssoldworldwidein2024.Thisgrowthreflectsincreasingparticipationincompetitiveswimming,triathlon(openwater),andmastersswimming,aswellastechnologicalinnovation(fabric,compression).Keyregions:NorthAmerica(3550-150 (training), 150−400(racing),150−400(racing),400-800+ (elite). Race suits are FINA-approved (Fédération Internationale de Natation) for competition. One-piece swimsuits (kneeskin, bodysuit) provide 5-15% drag reduction vs jammers (measured in flume testing). Coverage: kneeskin (to knees), full body (to ankles, banned for men? FINA rules: men’s swimsuit must not extend above navel or below knees). One-piece (torso + thighs) currently permitted. Full body (arms, legs) banned 2010 (polyurethane era). Fabric: polyester & spandex (PBT, chlorine-resistant, shape retention), nylon & spandex (soft, less durable). Outer water-repellent coating, inner compression.

Exclusive Observer Insights (Q1-Q2 2026): Key market trends include: (1) recycled materials (Econyl, Repreve); (2) 3D body scan custom fit (elite); (3) seamless construction (reduced chafing); (4) water-repellent coatings (less water absorption); (5) smart fabrics (biometric sensors). One-piece swimsuits advantages over jammers: reduced drag (cover upper body), muscle compression (abdominal, core), lower water absorption, better body alignment. Disadvantages: higher cost, harder to put on/take off (tight fit), less durable (racing suits 10-20 uses). Training one-piece suits: durable polyester, for daily practice. Racing suits: high compression, water-repellent, limited lifespan. Professional swimmers: elite, Olympic, NCAA, FINA Worlds. Amateur swimmers: masters, high-level age group, triathlon. Sizing: numeric (22-38) or alpha (XS-XXL). Fit: tight (compression, no wrinkles). Chlorine resistance: polyester (500+ hours), nylon (200-300 hours), spandex degrades. FINA regulations: men’s swimsuit must not cover neck, extend past shoulders, below knees. Permeability test. One-piece swimsuit (kneeskin) allowed. Full body banned (2010). Drag reduction coatings (hydrophobic). UV protection (outdoor/open water). Replacement: training suits 6-12 months, racing suits 10-20 races.

Key Market Segments: By Type, Application, and Material

Major players include Speedo (UK, market leader), Arena (Italy), TYR (US), O’Neill (US), Nike (US), Seafolly (Australia), Dolfin Swimwear (US), Adidas (Germany), Li Ning (China), Zoke (China), Hosa (China), Pulassi (China), and Decathlon (France).

Segment by Type

  • Polyester & Spandex – Larger segment (approx. 70% of market). PBT (polybutylene terephthalate) high chlorine resistance, shape retention, less stretch. Training suits.
  • Nylon & Spandex – Smaller segment (approx. 30% of market). Soft, comfortable, less chlorine resistant, more stretch. Racing suits, less durable.

Segment by Application

  • Amateur Swimmers – Larger volume (approx. 70% of units). Masters, triathlon, fitness.
  • Professional Swimmers – Smaller, higher value (approx. 30% of units). Elite, Olympic, NCAA.

Industry Layering: Men’s One-Piece Swimsuit Features

Feature Training One-Piece ($50-150) Racing One-Piece ($150-400) Elite Racing ($400-800+)
Fabric Polyester/spandex PBT/spandex LZR Pulse, high-compression
Chlorine resistance High (500+ hours) Moderate (100-200 hours) Low (10-20 races)
Water repellency Low High Very high
Compression Medium High Very high
Seams Stitched Bonded (flat) Laser-cut, welded
FINA approved No (training only) Yes (racing) Yes
Durability 12-24 months 6-12 months 10-20 races

Technological Challenges & Market Drivers (2025-2026)

  1. FINA regulations – Fabric type, coverage, thickness. 2010 full body ban. Kneeskin only.
  2. Chlorine degradation – Spandex loses elasticity. 100% polyester (PBT) more durable, less stretch.
  3. Donning difficulty – Racing suits very tight, requires assistance (break-in). Donning aids (gloves, plastic bags).
  4. Cost – Elite suits $400-800+ for limited races. Not affordable for age group.

Real-World User Case Study (2025-2026 Data):

An elite male swimmer (Olympic trials qualifier) upgraded from training jammers (40)toracingone−piecesuit(SpeedoLZR,40)toracingone−piecesuit(SpeedoLZR,500). Baseline (jammers): 100m freestyle time 49.5 sec. After racing suit (2025):

  • Time reduction: 0.5 sec (49.0 sec) (-1.0%).
  • Cost: 500(onesuit).10racinguses=500(onesuit).10racinguses=50 per race.
  • Qualification: made Olympic team (top 2). Priceless.
  • FINA legal: suit certified.
  • Result: Swimmer will race in one-piece for all championship meets.

Exclusive Industry Outlook (2027–2032):

Three strategic trajectories by 2028:

  1. Elite racing tier (Speedo, Arena, TYR) — 5-6% CAGR. $150-800.
  2. Training tier (Nike, Adidas, Dolfin, O’Neill) — 4-5% CAGR. $50-150.
  3. Value/China tier (Li Ning, Zoke, Hosa, Pulassi, Decathlon) — 5-6% CAGR (fastest-growing). $30-80.

Contact Us:
If you have any queries regarding this report or if you would like further information, please contact us:
Global Info Research
Add: 17890 Castleton Street Suite 369 City of Industry CA 91748 United States
EN: https://www.qyresearch.com
E-mail: global@qyresearch.com
Tel: 001-626-842-1666(US)
JP: https://www.qyresearch.co.jp


カテゴリー: 未分類 | 投稿者huangsisi 11:49 | コメントをどうぞ