

QY Research Inc. (Global Market Report Research Publisher) announces the release of 2025 latest report “Rack Manifold for Liquid Cooling System- Global Market Share and Ranking, Overall Sales and Demand Forecast 2026-2032”. Based on current situation and impact historical analysis (2020-2024) and forecast calculations (2026-2032), this report provides a comprehensive analysis of the global Rack Manifold for Liquid Cooling System market, including market size, share, demand, industry development status, and forecasts for the next few years.
The global market for Rack Manifold for Liquid Cooling System was estimated to be worth US$ 205 million in 2025 and is projected to reach US$ 413 million, growing at a CAGR of 6.9% from 2026 to 2032.
【Get a free sample PDF of this report (Including Full TOC, List of Tables & Figures, Chart)】
https://www.qyresearch.com/reports/6290074/rack-manifold-for-liquid-cooling-system
Rack Manifold for Liquid Cooling System Market Summary
Rack Manifolds for liquid cooling systems are rack-level distribution assemblies that route supply and return coolant to multiple servers or cold plates within a rack. They typically include supply/return headers, ports with dripless quick disconnects, isolation and balancing valves, flow meters, temperature/pressure sensors, air-bleed and drain functions, and mounting hardware. By centralizing distribution, manifolds simplify installation, enable consistent flow control, and support modular scaling of direct-to-chip liquid cooling. They also improve serviceability by allowing hot-swap of cooled nodes while maintaining stable rack hydraulics and minimizing downtime and leak risk.
The industrial chain of Rack Manifolds includes upstream stainless steel or copper tubing, manifolds and fittings, valves, quick disconnect couplings, seals, filters, sensors, flow meters, insulation, brackets, and control wiring. Midstream integrates mechanical design, welding/brazing or machining, surface treatment, leak testing, pressure testing, cleaning and passivation, assembly of instrumentation, and quality inspection for compatibility and cleanliness. Downstream users are liquid-cooled server OEMs, rack integrators, data center operators, and colocation facilities deploying direct-to-chip or cold-plate loops. Supporting services include commissioning, flushing, water-quality management, maintenance, and spare parts.
In 2025, global Rack Manifold for Liquid Cooling System production reached approximately 9,760 units, with an average global market price of around US$ 21,000 per unit, and a gross profit margin of approximately 20%-40%. According to the new market research report “Global Rack Manifold for Liquid Cooling System Market Report 2026-2032”, published by QYResearch, the global Rack Manifold for Liquid Cooling System market size is projected to reach USD 0.41 billion by 2032, at a CAGR of 6.9% during the forecast period.
Global Rack Manifold for Liquid Cooling System Market Size (US$ Million), 2020-2031
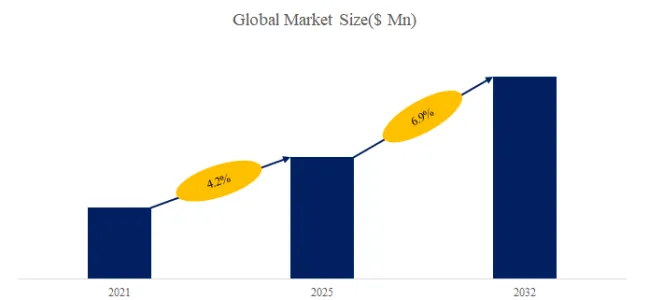
Above data is based on report from QYResearch: Global Rack Manifold for Liquid Cooling System Market Report 2021-2032 (published in 2025). If you need the latest data, plaese contact QYResearch.
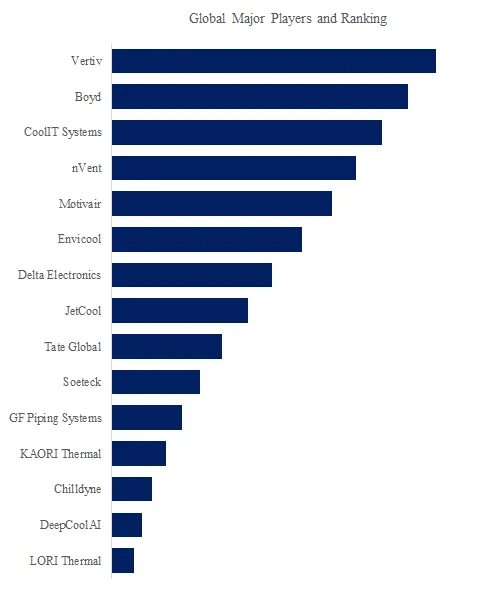
Global Rack Manifold for Liquid Cooling System Top 5 Players Ranking and Market Share (Ranking is based on the revenue of 2025, continually updated)
Above data is based on report from QYResearch: Global Rack Manifold for Liquid Cooling System Market Report 2026-2032 (published in 2025). If you need the latest data, plaese contact QYResearch.
According to QYResearch Top Players Research Center, the global key manufacturers of Rack Manifold for Liquid Cooling System include Vertiv, Boyd, CoolIT Systems, nVent, Motivair, Envicool, Delta Electronics, JetCool, Tate Global, Soeteck, etc. In 2025, the global top five players had a share approximately 42.0% in terms of revenue.
Rack Manifold for Liquid Cooling System Market Trends
1. Rack manifolds are evolving from simple pipe assemblies into engineered, modular fluid-distribution products.
Vendors increasingly position rack manifolds as standardized yet configurable subsystems rather than custom on-site plumbing. Vertiv describes its rack manifolds as stainless-steel, zero-U assemblies with dripless quick disconnects for scalable deployment, while CoolIT emphasizes a wide range of configurations for global DLC installations. Vertiv’s broader manifold guidance also highlights modularity, prefabrication, and compatibility with both greenfield and brownfield deployments. This indicates a market trend toward faster deployment, cleaner rack integration, and productization of what used to be more project-specific fluid-routing hardware.
2. Rack-manifold demand is being pulled upward by extreme AI density and multi-layer liquid-cooling architectures.
This means rack manifolds are no longer just supporting isolated HPC cabinets; they are increasingly part of scalable, layered cooling architectures that connect CDUs, row manifolds, and in-rack manifolds across dense AI clusters. As AI racks become hotter, more compact, and more numerous, manifold design is becoming more specialized and more central to system performance.
Rack Manifold for Liquid Cooling System Market Driving Factors and Opportunities
1. AI and high-density compute are the core growth engine.
The strongest driver for rack-manifold demand is the rapid rise in thermal density from AI servers and accelerators. Because rack manifolds sit at the final coolant-distribution layer inside the rack, every increase in rack density and every expansion of direct-to-chip cooling enlarges the need for reliable manifold infrastructure. The opportunity is especially attractive because this demand is tied not only to data center construction, but also to the continuing power escalation of GPUs, TPUs, and other accelerators.
2. Retrofit-friendly deployment and high-density colocation create a broad commercial market.
Digital Realty’s high-density colocation offer starts at 30 kW per cabinet and scales to 150 kW per cabinet, showing that commercial demand is spreading beyond hyperscale self-builds into modular colocation environments. This creates opportunities for manifold suppliers that can offer compact installation, standardized interfaces, prefabricated assemblies, and fast deployment in both brownfield retrofits and tenant-by-tenant AI expansions.
3. Standardization, pre-commissioning, and supply-chain readiness are becoming major value pools.
OCP’s 2025 guidance for row manifolds shows that liquid-cooled deployments now require structured procedures for cleaning, flushing, and preparing technology cooling systems, rather than ad hoc field practice. Google’s decision to contribute its next-generation CDU design to OCP likewise signals growing ecosystem standardization, while Reuters reports that AI liquid-cooling supply is tightening and that even lower-value cooling components are becoming bottlenecks. This creates a sizable opportunity beyond the manifold hardware itself: vendors can win by offering engineered flow design, pre-fabrication, commissioning support, traceability, and scalable manufacturing capacity. In other words, the market opportunity is shifting from “sell a manifold” toward “deliver a deployable, qualified liquid-cooling distribution solution.”
The report provides a detailed analysis of the market size, growth potential, and key trends for each segment. Through detailed analysis, industry players can identify profit opportunities, develop strategies for specific customer segments, and allocate resources effectively.
The Rack Manifold for Liquid Cooling System market is segmented as below:
By Company
Vertiv
Boyd
CoolIT Systems
nVent
Motivair
Envicool
Delta Electronics
JetCool
Tate Global
Soeteck
GF Piping Systems
KAORI Thermal
Chilldyne
DeepCoolAI
LORI Thermal
Segment by Type
Horizontal
Vertical
Segment by Application
Internet
Telecommunications
Others
Each chapter of the report provides detailed information for readers to further understand the Rack Manifold for Liquid Cooling System market:
Chapter 1: Introduces the report scope of the Rack Manifold for Liquid Cooling System report, global total market size (valve, volume and price). This chapter also provides the market dynamics, latest developments of the market, the driving factors and restrictive factors of the market, the challenges and risks faced by manufacturers in the industry, and the analysis of relevant policies in the industry. (2021-2032)
Chapter 2: Detailed analysis of Rack Manifold for Liquid Cooling System manufacturers competitive landscape, price, sales and revenue market share, latest development plan, merger, and acquisition information, etc. (2021-2026)
Chapter 3: Provides the analysis of various Rack Manifold for Liquid Cooling System market segments by Type, covering the market size and development potential of each market segment, to help readers find the blue ocean market in different market segments. (2021-2032)
Chapter 4: Provides the analysis of various market segments by Application, covering the market size and development potential of each market segment, to help readers find the blue ocean market in different downstream markets.(2021-2032)
Chapter 5: Sales, revenue of Rack Manifold for Liquid Cooling System in regional level. It provides a quantitative analysis of the market size and development potential of each region and introduces the market development, future development prospects, market space, and market size of each country in the world..(2021-2032)
Chapter 6: Sales, revenue of Rack Manifold for Liquid Cooling System in country level. It provides sigmate data by Type, and by Application for each country/region.(2021-2032)
Chapter 7: Provides profiles of key players, introducing the basic situation of the main companies in the market in detail, including product sales, revenue, price, gross margin, product introduction, recent development, etc. (2021-2026)
Chapter 8: Analysis of industrial chain, including the upstream and downstream of the industry.
Chapter 9: Conclusion.
Benefits of purchasing QYResearch report:
Competitive Analysis: QYResearch provides in-depth Rack Manifold for Liquid Cooling System competitive analysis, including information on key company profiles, new entrants, acquisitions, mergers, large market shear, opportunities, and challenges. These analyses provide clients with a comprehensive understanding of market conditions and competitive dynamics, enabling them to develop effective market strategies and maintain their competitive edge.
Industry Analysis: QYResearch provides Rack Manifold for Liquid Cooling System comprehensive industry data and trend analysis, including raw material analysis, market application analysis, product type analysis, market demand analysis, market supply analysis, downstream market analysis, and supply chain analysis.
and trend analysis. These analyses help clients understand the direction of industry development and make informed business decisions.
Market Size: QYResearch provides Rack Manifold for Liquid Cooling System market size analysis, including capacity, production, sales, production value, price, cost, and profit analysis. This data helps clients understand market size and development potential, and is an important reference for business development.
Other relevant reports of QYResearch:
Global Rack Manifold for Liquid Cooling System Market Outlook, In‑Depth Analysis & Forecast to 2032
Global Rack Manifold for Liquid Cooling System Market Research Report 2026
Global Rack Manifold for Liquid Cooling System Sales Market Report, Competitive Analysis and Regional Opportunities 2026-2032
Rack Manifolds for Liquid Cooling Systems- Global Market Share and Ranking, Overall Sales and Demand Forecast 2026-2032
Global Rack Manifolds for Liquid Cooling Systems Sales Market Report, Competitive Analysis and Regional Opportunities 2026-2032
Global Rack Manifolds for Liquid Cooling Systems Market Outlook, In‑Depth Analysis & Forecast to 2032
Global Rack Manifolds for Liquid Cooling Systems Market Research Report 2026
About Us:
QYResearch founded in California, USA in 2007, which is a leading global market research and consulting company. Our primary business include market research reports, custom reports, commissioned research, IPO consultancy, business plans, etc. With over 19 years of experience and a dedicated research team, we are well placed to provide useful information and data for your business, and we have established offices in 7 countries (include United States, Germany, Switzerland, Japan, Korea, China and India) and business partners in over 30 countries. We have provided industrial information services to more than 60,000 companies in over the world.
Contact Us:
If you have any queries regarding this report or if you would like further information, please contact us:
QY Research Inc.
Add: 17890 Castleton Street Suite 369 City of Industry CA 91748 United States
EN: https://www.qyresearch.com
Email: global@qyresearch.com
Tel: 001-626-842-1666(US)
JP: https://www.qyresearch.co.jp


