

Silicon Steel Soft Magnetic Alloy Market Summary
The global Silicon Steel Soft Magnetic Alloy market size is estimated to reach US$ 15646.2 million by 2026 and is anticipated to reach US$ 23218.6 million by 2032, witnessing a CAGR of 6.80% during the forecast period 2026-2032.
Figure00001. Global Silicon Steel Soft Magnetic Alloy Market Size (US$ Million), 2021-2032
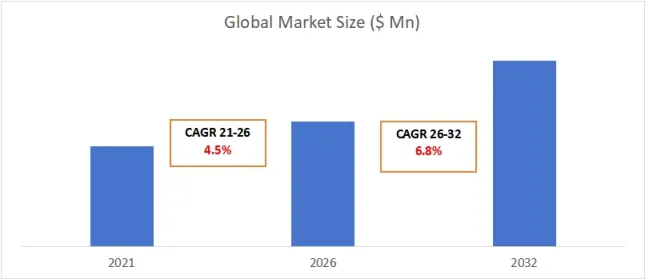
Above data is based on report from QYResearch: Global Silicon Steel Soft Magnetic Alloy Market Report 2025-2031 (published in 2025). If you need the latest data, please contact QYResearch.
In 2025, the global top 10 players revenue share was approximately 84.30%.
Figure00002. Global Silicon Steel Soft Magnetic Alloy Top 10 Players Ranking and Market Share
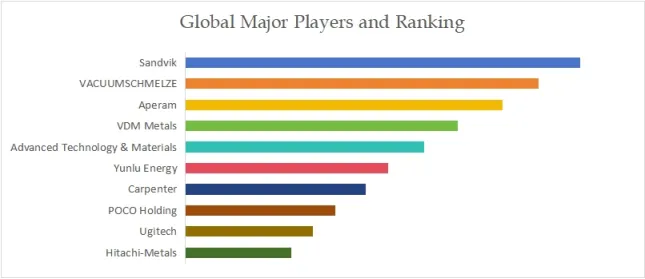
Above data is based on report from QYResearch: Global Silicon Steel Soft Magnetic Alloy Market Report 2025-2031 (published in 2025). If you need the latest data, plaese contact QYResearch.
Silicon steel soft magnetic alloy, commonly known as electrical steel, is a specialized ferrous alloy primarily composed of iron with a silicon content typically ranging from 1% to 6.5%. The addition of silicon increases the material’s electrical resistivity, which reduces eddy current losses, and decreases magnetic hysteresis loss. This results in a soft magnetic material with high magnetic permeability and low core loss, making it ideal for efficiently conducting and concentrating magnetic flux in alternating current applications. It is produced in thin sheets or laminations to further mitigate eddy currents.
Competitive Landscape
The market for silicon steel soft magnetic alloys is an oligopoly dominated by a small number of global, technology-intensive manufacturers. Leaders include European giants like VACUUMSCHMELZE, Aperam, and Sandvik, as well as key Japanese players like Hitachi-Metals. These companies compete on the basis of proprietary metallurgical processes, product purity, consistency, and the ability to produce high-performance grades (especially grain-oriented silicon steel). Other significant competitors include Carpenter, VDM Metals, and specialized manufacturers like Advanced Technology & Materials. Chinese firms are growing in influence, particularly in the non-oriented segment. Competition is based on technological innovation, product performance, global supply capability, and deep relationships with large industrial customers in the power and automotive sectors.
Main Type
The material is classified into three main types based on its crystalline structure and silicon content. Grain-Oriented Silicon Steel (GOES) undergoes a secondary recrystallization process to develop a highly aligned grain structure, resulting in superior magnetic properties in the rolling direction. It is the material of choice for the cores of high-efficiency power and distribution transformers. Non-Grain-Oriented Silicon Steel (NGOES) has a random grain structure, offering more isotropic magnetic properties suitable for rotating equipment like motors and generators. High Silicon Steel Alloy refers to grades with silicon content typically above 3%, offering even higher resistivity and lower core loss for high-frequency applications, though often with reduced mechanical strength.
Downstream Applications
Its downstream applications are foundational to the electrical and electro-mobility industries. In Consumer Electronics, it is used in small transformers, inductors, and power supplies. The Power sector is the largest consumer, using GOES for transformer cores and NGOES for large generators. The New Energy Vehicles sector is a major growth driver, utilizing high-performance NGOES in the stators and rotors of traction motors, drive systems, and onboard chargers due to its need for high efficiency and power density. The Others category includes applications in industrial motors, renewable energy generators (wind turbines), and other specialized electromagnetic devices.
Regional Perspective
Asia Pacific is the dominant market, both in terms of production and consumption, driven by China’s massive electrical infrastructure build-out, manufacturing base for consumer electronics and EVs, and the presence of key regional players. Europe and North America are mature, high-value markets with demand focused on high-efficiency products for grid upgrades, premium automotive, and replacement of aging infrastructure. Latin America and the Middle East & Africa are emerging markets, with growth tied to power capacity expansion and gradual industrialization. The regional dynamics are heavily influenced by the global supply chains of the automotive and heavy electrical equipment industries.
Price Analysis
Pricing is highly tiered and dependent on grade, performance, and form. Standard, commodity-grade NGOES is price-competitive, with costs closely tied to raw material (iron, silicon, ferroalloys) and energy prices. High-performance GOES, especially the highest-efficiency grades, commands a significant premium due to complex, energy-intensive manufacturing processes (including cold rolling, decarburization, and high-temperature annealing) and limited global production capacity. High-silicon alloys for specialized applications also have higher prices. Market prices are influenced by global steel trade policies, energy costs, and demand-supply imbalances in key sectors like electric vehicles. Long-term contracts are common with large buyers.
About The Authors
Yang Huchen | Industry Researcher
Personal Profile
With six years of experience in equipment industry research and consulting, I have consistently tracked the development of mechanical equipment and industrial technology both domestically and internationally, accumulating extensive experience in industry research, data analysis, and market forecasting. I possess a solid foundation in industry trend insights, corporate strategy analysis, market sizing, and competitive landscape research, enabling me to provide clients with forward-looking and actionable research results.
Research Areas
Mechanical Equipment: Including port machinery, special equipment, and engineering equipment.
Industrial Automation: Covering intelligent manufacturing, robotics, sensing and control systems.
Construction Machinery: Key areas such as cranes, excavators, and concrete machinery.
Frontier Equipment: High-tech cryo-electron microscopes, laser weapons, and other cutting-edge technologies.
Project Experience
Led and participated in numerous key research and consulting projects, including:
Mobile Port Cranes: Analyzing global and Chinese market supply and demand patterns, price trends, and technology roadmaps, producing industry benchmark reports.
Cryo-electron microscopes: Analyzing the competitive landscape of core suppliers within the industry chain and the prospects for cutting-edge applications, providing guidance to scientific research institutions. Providing decision support to institutions and enterprises.
Laser Weapon Systems: Tracks emerging equipment markets in the military industry, analyzing the policy environment, technological evolution paths, and application potential.
Engineering Machinery Industry Research Series: Covers equipment such as excavators and loaders, builds competitiveness models, and provides development recommendations.
Partner Clients
Clients include top international manufacturers and leading domestic manufacturers, including:
Toshiba、Honda、Caterpillar、Hitachi、etc.
In addition, we provide research and strategic consulting services to some leading domestic equipment companies and emerging manufacturing companies in China.
Personal Strengths
Systematic Research Ability: Specializes in comprehensive industry chain analysis, with in-depth research experience from upstream components to downstream application scenarios.
Interdisciplinary Perspective: Able to establish research connections between traditional machinery and emerging high-end equipment.
Data-Driven: Proficient in market sizing, price modeling, and trend forecasting.
International Background: Experienced in multinational corporate research, with a deep understanding of international market dynamics and local market differences.
Contact Information
Email: yanghuchen@qyresearch.com
Tel: +86-17801072109
https://www.qyresearch.com
QYResearch founded in California, USA in 2007.It is a leading global market research and consulting company. With over 17 years’ experience and professional research team in various cities over the world QY Research focuses on management consulting, database and seminar services, IPO consulting, industry chain research and customized research to help our clients in providing non-linear revenue model and make them successful. We are globally recognized for our expansive portfolio of services, good corporate citizenship, and our strong commitment to sustainability. Up to now, we have cooperated with more than 60,000 clients across five continents. Let’s work closely with you and build a bold and better future.
QYResearch is a world-renowned large-scale consulting company. The industry covers various high-tech industry chain market segments, spanning the semiconductor industry chain (semiconductor equipment and parts, semiconductor materials, ICs, Foundry, packaging and testing, discrete devices, sensors, optoelectronic devices), photovoltaic industry chain (equipment, cells, modules, auxiliary material brackets, inverters, power station terminals), new energy automobile industry chain (batteries and materials, auto parts, batteries, motors, electronic control, automotive semiconductors, etc.), communication industry chain (communication system equipment, terminal equipment, electronic components, RF front-end, optical modules, 4G/5G/6G, broadband, IoT, digital economy, AI), advanced materials industry Chain (metal materials, polymer materials, ceramic materials, nano materials, etc.), machinery manufacturing industry chain (CNC machine tools, construction machinery, electrical machinery, 3C automation, industrial robots, lasers, industrial control, drones), food, beverages and pharmaceuticals, medical equipment, agriculture, etc.
About Us:
QYResearch founded in California, USA in 2007, which is a leading global market research and consulting company. Our primary business include market research reports, custom reports, commissioned research, IPO consultancy, business plans, etc. With over 18 years of experience and a dedicated research team, we are well placed to provide useful information and data for your business, and we have established offices in 7 countries (include United States, Germany, Switzerland, Japan, Korea, China and India) and business partners in over 30 countries. We have provided industrial information services to more than 60,000 companies in over the world.
Contact Us:
If you have any queries regarding this report or if you would like further information, please contact us:
QY Research Inc.
Add: 17890 Castleton Street Suite 369 City of Industry CA 91748 United States
EN: https://www.qyresearch.com
Email: global@qyresearch.com
Tel: 001-626-842-1666(US)
JP: https://www.qyresearch.co.jp


