QY Research Inc. (Global Market Report Research Publisher) announces the release of 2025 latest report “Alcohol Drink- Global Market Share and Ranking, Overall Sales and Demand Forecast 2026-2032”. Based on current situation and impact historical analysis (2020-2024) and forecast calculations (2026-2032), this report provides a comprehensive analysis of the global Alcohol Drink market, including market size, share, demand, industry development status, and forecasts for the next few years.
The global market for Alcohol Drink was estimated to be worth US$ 83600 million in 2025 and is projected to reach US$ 128120 million, growing at a CAGR of 6.4% from 2026 to 2032.
【Get a free sample PDF of this report (Including Full TOC, List of Tables & Figures, Chart)】
https://www.qyresearch.com/reports/5580534/alcohol-drink
Alcohol Drink Market Summary
Alcohol drinks cover beer, wine (including red wine), imported spirits, Chinese baijiu, huangjiu/sake, ready-to-drink (RTD) beverages, alcohol-free alternatives, and other fermented or flavored alcoholic products. In China, alcohol consumption is shaped by strong social, gifting, and business occasions, while gradually shifting toward more home-based, lighter, and “self-reward” consumption scenarios.
According to QYResearch’s “China Alcohol Drink Market Report 2026–2032,” the China Alcohol Drink market is projected to reach USD 254.1 billion by 2032, at a CAGR of 6.6% during the forecast period (per report definition). In China, the 2025 revenue mix is highly concentrated: baijiu accounts for 78.57%, followed by beer (11.22%) and other categories (6.45%). Wine (0.97%), imported spirits (1.17%), huangjiu/sake (0.90%), RTD (0.42%), and alcohol-free beverages (0.31%) remain relatively small—implying that baijiu still anchors the market, while incremental growth increasingly comes from premiumization and new-category penetration.
Figure00001. China Alcohol Drink Market Size (US$ million), 2026-2033
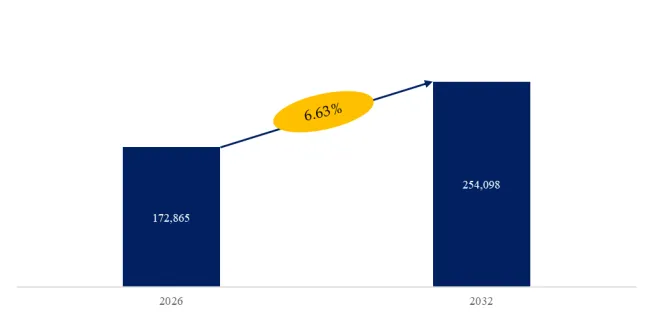
Above data is based on report from QYResearch: Global Alcohol Drink Market Report 2026-2032 (published in 2026). If you need the latest data, plaese contact QYResearch.
Technical Characteristics and Product Segmentation
In alcohol, “technology” is embedded in raw materials, fermentation/distillation, aging systems, blending/formulation capability, and packaging/channel fit—ultimately translating into brand premium and price-tier differentiation.
Baijiu relies on solid-state fermentation, aging, and blending techniques, enabling strong brand equity but also introducing inventory and price-cycle sensitivity. Beer is the most industrialized segment, where scale and channel execution matter most, while growth increasingly comes from premiumization and scenario-based offerings. Wine and huangjiu depend heavily on consumer education and occasion rebuilding. Imported spirits are still dominated by multinational brand owners, with local competition mainly occurring through distribution and localization strategies. RTD and low-alcohol beverages are driven by formulation innovation and fast product iteration. Alcohol-free beverages require de-alcoholization and flavor reconstruction technologies; globally, major brewers are actively expanding no/low-alcohol portfolios, aligned with wellness trends.
Competitive Landscape and Company Dynamics (China Focus)
China’s alcohol market shows a “baijiu-dominant + beer oligopoly + fragmented long-tail” structure.
In baijiu, leading listed companies include Kweichow Moutai, Wuliangye, Shanxi Fenjiu, Luzhou Laojiao, Yanghe, Gujing Gong, Jinshiyuan, Yingjia, Shede, Kouzijiao, Zhenjiu Li Du, Shuijingfang, Laobaigan, Jiugui, Jinzhongzi, Huangtai, Yilite, among others. Competition centers on brand premium, channel control, price-tier expansion, and healthier inventory management.
In beer, listed leaders such as Tsingtao Brewery, Chongqing Brewery (Carlsberg-controlled), Yanjing Brewery, China Resources Beer (Snow), and Budweiser Brewing APAC compete primarily through premiumization, on-trade recovery, and portfolio optimization.
Wine/huangjiu players (e.g., Changyu, CITIC Niya, Weilong, Dynasty, Kuaijishan, Guyuelongshan, Jinfeng) remain smaller in scale, where efficiency and occasion rebuilding matter more than pure volume growth. Imported spirits remain dominated by global brand owners, making distribution dynamics a key observation point.
RTD is led by Baichang/Bairun (RIO and related products). The segment is innovation-driven but can be volatile, with market discussions highlighting cyclical pressure and fast product life cycles.
For alcohol-free, global demand growth and corporate investments are becoming increasingly visible, reinforcing the long-term direction even though China remains at an early stage.
Case Studies and Technology Breakthroughs
Key innovations include digital brewing and traceability systems for quality stability, de-alcoholization technologies (e.g., vacuum distillation) to improve the taste of alcohol-free beer, and packaging/scenario innovation such as smaller sizes and ready-to-drink formats.
Tariff Policies and Supply Chain Restructuring
Tariff and policy shifts impact imported wine and spirits more directly through retail pricing and channel margins. Meanwhile, multinational groups are strengthening “Beyond Beer” strategies through acquisitions and portfolio expansion, reflecting continuous investment in RTD growth engines.
Future Trends and Challenges (China View)
Over the next 3–5 years, China is likely to see a pattern of “baijiu anchoring the base, beer competing via premiumization, low/RTD and alcohol-free building incremental growth, and wine/huangjiu rebuilding occasions.” Key challenges include consumption tiering pressure, cost volatility, channel fragmentation, and tightening regulatory compliance.
The report provides a detailed analysis of the market size, growth potential, and key trends for each segment. Through detailed analysis, industry players can identify profit opportunities, develop strategies for specific customer segments, and allocate resources effectively.
The Alcohol Drink market is segmented as below:
By Company
Anheuser-Busch InBev
Diageo plc
Heineken
Pernod Ricard
Carlsberg Group
Molson Coors Beverage Company
Constellation Brands
Brown-Forman Corporation
Asahi Group Holdings
Kirin Holdings Company
Beam Suntory
E.&J. Gallo Winery
Treasury Wine Estates
China Resources Snow Breweries
Thai Beverage (ThaiBev)
Kweichow Moutai Co., Ltd
Wuliangye Group
Tsingtao Brewery Co., Ltd
Segment by Type
Beer
Wine
Spirits/Distilled Liquor
Cider & Perry
Ready-to-Drink (RTD) Alcoholic Beverages
Liqueurs & Aperitifs
Segment by Application
Male
Female
Each chapter of the report provides detailed information for readers to further understand the Alcohol Drink market:
Chapter 1: Introduces the report scope of the Alcohol Drink report, global total market size (valve, volume and price). This chapter also provides the market dynamics, latest developments of the market, the driving factors and restrictive factors of the market, the challenges and risks faced by manufacturers in the industry, and the analysis of relevant policies in the industry. (2021-2032)
Chapter 2: Detailed analysis of Alcohol Drink manufacturers competitive landscape, price, sales and revenue market share, latest development plan, merger, and acquisition information, etc. (2021-2026)
Chapter 3: Provides the analysis of various Alcohol Drink market segments by Type, covering the market size and development potential of each market segment, to help readers find the blue ocean market in different market segments. (2021-2032)
Chapter 4: Provides the analysis of various market segments by Application, covering the market size and development potential of each market segment, to help readers find the blue ocean market in different downstream markets.(2021-2032)
Chapter 5: Sales, revenue of Alcohol Drink in regional level. It provides a quantitative analysis of the market size and development potential of each region and introduces the market development, future development prospects, market space, and market size of each country in the world..(2021-2032)
Chapter 6: Sales, revenue of Alcohol Drink in country level. It provides sigmate data by Type, and by Application for each country/region.(2021-2032)
Chapter 7: Provides profiles of key players, introducing the basic situation of the main companies in the market in detail, including product sales, revenue, price, gross margin, product introduction, recent development, etc. (2021-2026)
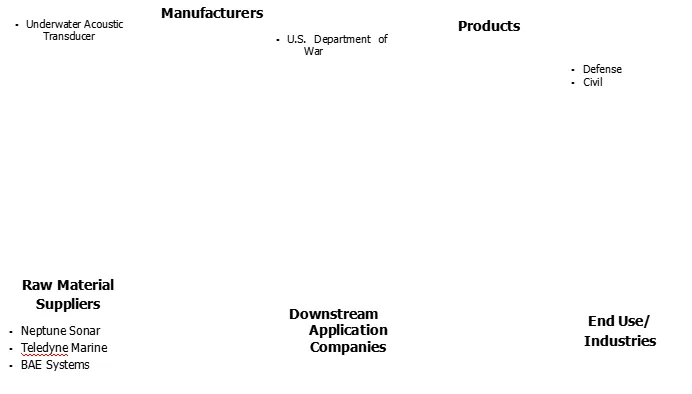
Chapter 8: Analysis of industrial chain, including the upstream and downstream of the industry.
Chapter 9: Conclusion.
Benefits of purchasing QYResearch report:
Competitive Analysis: QYResearch provides in-depth Alcohol Drink competitive analysis, including information on key company profiles, new entrants, acquisitions, mergers, large market shear, opportunities, and challenges. These analyses provide clients with a comprehensive understanding of market conditions and competitive dynamics, enabling them to develop effective market strategies and maintain their competitive edge.
Industry Analysis: QYResearch provides Alcohol Drink comprehensive industry data and trend analysis, including raw material analysis, market application analysis, product type analysis, market demand analysis, market supply analysis, downstream market analysis, and supply chain analysis.
and trend analysis. These analyses help clients understand the direction of industry development and make informed business decisions.
Market Size: QYResearch provides Alcohol Drink market size analysis, including capacity, production, sales, production value, price, cost, and profit analysis. This data helps clients understand market size and development potential, and is an important reference for business development.
Other relevant reports of QYResearch:
Global Alcohol Drink Sales Market Report, Competitive Analysis and Regional Opportunities 2026-2032
Global Alcohol Drink Market Research Report 2026
About Us:
QYResearch founded in California, USA in 2007, which is a leading global market research and consulting company. Our primary business include market research reports, custom reports, commissioned research, IPO consultancy, business plans, etc. With over 19 years of experience and a dedicated research team, we are well placed to provide useful information and data for your business, and we have established offices in 7 countries (include United States, Germany, Switzerland, Japan, Korea, China and India) and business partners in over 30 countries. We have provided industrial information services to more than 60,000 companies in over the world.
Contact Us:
If you have any queries regarding this report or if you would like further information, please contact us:
QY Research Inc.
Add: 17890 Castleton Street Suite 369 City of Industry CA 91748 United States
EN: https://www.qyresearch.com
Email: global@qyresearch.com
Tel: 001-626-842-1666(US)
JP: https://www.qyresearch.co.jp