Tile-in Shower Drain Market Summary
The global Tile-in Shower Drain market size is estimated to reach US$ 1240.9 million by 2026 and is anticipated to reach US$ 1958.2 million by 2032, witnessing a CAGR of 7.90% during the forecast period 2026-2032.
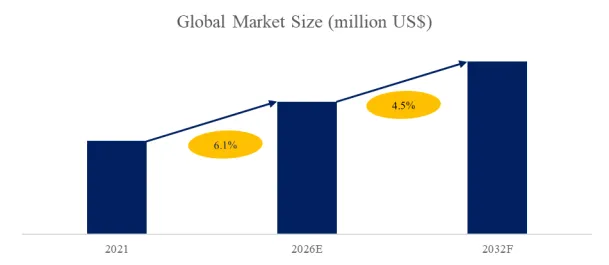
Figure00001. Global Tile-in Shower Drain Market Size (US$ Million), 2021-2032
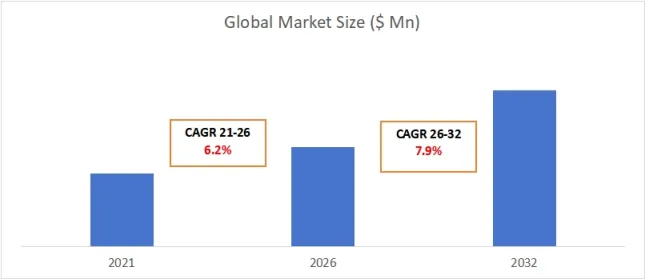
Above data is based on report from QYResearch: Global Tile-in Shower Drain Market Report 2025-2031 (published in 2025). If you need the latest data, please contact QYResearch.
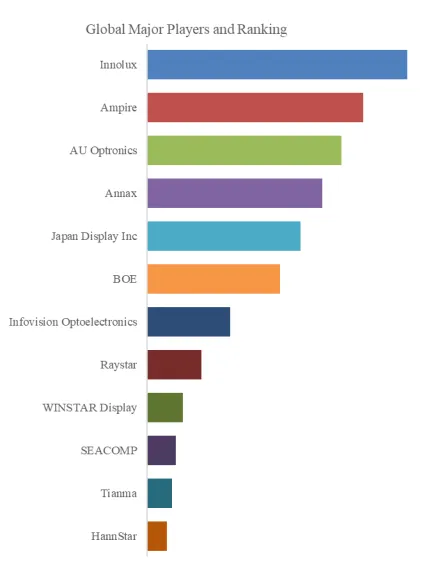
In 2025, the global top 10 players revenue share was approximately 65%.
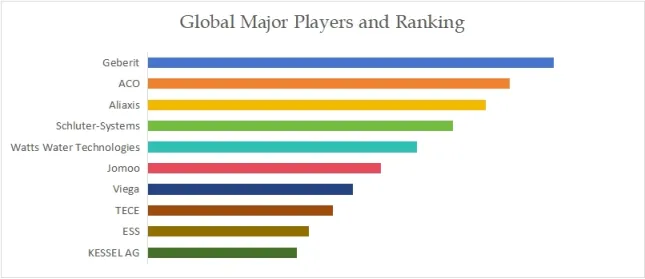
Figure00002. Global Tile-in Shower Drain Top 10 Players Ranking and Market Share
Above data is based on report from QYResearch: Global Tile-in Shower Drain Market Report 2025-2031 (published in 2025). If you need the latest data, plaese contact QYResearch.
A tile-in shower drain is a specialized drainage system designed to be seamlessly integrated into a tiled shower floor. Unlike traditional point drains, it is installed flush with the surrounding tile surface, creating a continuous, waterproof plane. Its key components are a linear or geometric grating (the visible part) and a concealed drain body that channels water into the plumbing system. Its primary function is efficient water removal while providing critical waterproofing as part of a modern, level-access (“curbless”) shower design, enhancing both aesthetics and accessibility.
Competitive Landscape
The market is characterized by strong competition among established global players specializing in drainage and plumbing systems. European companies dominate the premium segment, led by Geberit and ACO, which are known for engineering precision, high-quality materials, and extensive product systems. Schluter-Systems is a major force due to its integrated waterproofing and uncoupling membrane systems, of which its tile-in drains are a key component. Other significant competitors include Aliaxis, Viega, TECE, and KESSEL AG. In the Asia Pacific region, companies like Jomoo are important. The competition is based on system compatibility (with waterproofing membranes), design options (grates, sizes), material quality (stainless steel, brass), ease of installation, and brand reputation for reliability and leak prevention.
Main Type
Tile-in shower drains are primarily categorized by their shape and layout. Linear Shower Drains are the most popular modern type, featuring a long, narrow channel. They allow for a single, gentle slope across the entire shower floor, are highly effective for larger showers, and offer a sleek, contemporary look. Square Shower Drains (or point drains) are a more traditional tile-in style, typically installed in the center of the shower, requiring a four-way slope (pan) to direct water. They are common in smaller, standard shower stalls. Corner Shower Drains are installed in a corner of the shower, useful for optimizing space in compact or uniquely shaped showers, requiring a two or three-way slope.
Downstream Applications
The two main downstream applications are Residential and Commercial construction. In the Residential sector, tile-in drains are a key feature in bathroom renovations and new home builds, driven by trends towards luxurious, spa-like master bathrooms, accessibility (aging-in-place designs), and modern minimalist aesthetics. The Commercial sector is a major adopter, including hotels, gyms, spas, public showers, and healthcare facilities. Here, the demands are for high durability, ease of maintenance, hygiene (often with antimicrobial coatings), and compliance with accessibility codes, making reliable, well-engineered drainage systems essential.
Regional Perspective
Europe is the most mature and leading market, with a strong tradition of high-quality tiling and bathroom design, and is home to the industry’s top brands. North America has seen rapid adoption over the last decade, fueled by the popularity of modern bathroom aesthetics and accessible design. The Asia Pacific region is a high-growth market, especially in luxury residential and hospitality developments in China, Australia, and Southeast Asia. Latin America and the Middle East & Africa are emerging markets where growth is concentrated in high-end residential projects, luxury hotels, and commercial developments in major urban centers, following global design trends.
Price Analysis
Pricing varies significantly based on brand, material, and features. Basic, small-format square drains from standard brands are the most affordable. Linear drains command a higher price due to more material (longer channels), more complex manufacturing, and their premium positioning. Prices escalate with the use of high-grade materials like solid stainless steel (304/316), brass, or custom finishes. Premium brands like Geberit, Schluter, and ACO carry a price premium justified by engineering, guaranteed compatibility with their waterproofing systems, and proven long-term reliability. Additional costs include the required waterproofing membrane, sealants, and professional installation labor, which is more specialized than for traditional drains.
About The Authors
Yang Huchen | Industry Researcher
Personal Profile
With six years of experience in equipment industry research and consulting, I have consistently tracked the development of mechanical equipment and industrial technology both domestically and internationally, accumulating extensive experience in industry research, data analysis, and market forecasting. I possess a solid foundation in industry trend insights, corporate strategy analysis, market sizing, and competitive landscape research, enabling me to provide clients with forward-looking and actionable research results.
Research Areas
Mechanical Equipment: Including port machinery, special equipment, and engineering equipment.
Industrial Automation: Covering intelligent manufacturing, robotics, sensing and control systems.
Construction Machinery: Key areas such as cranes, excavators, and concrete machinery.
Frontier Equipment: High-tech cryo-electron microscopes, laser weapons, and other cutting-edge technologies.
Project Experience
Led and participated in numerous key research and consulting projects, including:
Mobile Port Cranes: Analyzing global and Chinese market supply and demand patterns, price trends, and technology roadmaps, producing industry benchmark reports.
Cryo-electron microscopes: Analyzing the competitive landscape of core suppliers within the industry chain and the prospects for cutting-edge applications, providing guidance to scientific research institutions. Providing decision support to institutions and enterprises.
Laser Weapon Systems: Tracks emerging equipment markets in the military industry, analyzing the policy environment, technological evolution paths, and application potential.
Engineering Machinery Industry Research Series: Covers equipment such as excavators and loaders, builds competitiveness models, and provides development recommendations.
Partner Clients
Clients include top international manufacturers and leading domestic manufacturers, including:
Toshiba、Honda、Caterpillar、Hitachi、etc.
In addition, we provide research and strategic consulting services to some leading domestic equipment companies and emerging manufacturing companies in China.
Personal Strengths
Systematic Research Ability: Specializes in comprehensive industry chain analysis, with in-depth research experience from upstream components to downstream application scenarios.
Interdisciplinary Perspective: Able to establish research connections between traditional machinery and emerging high-end equipment.
Data-Driven: Proficient in market sizing, price modeling, and trend forecasting.
International Background: Experienced in multinational corporate research, with a deep understanding of international market dynamics and local market differences.
Contact Information
Email: yanghuchen@qyresearch.com
Tel: +86-17801072109
About QYResearch

https://www.qyresearch.com
QYResearch founded in California, USA in 2007.It is a leading global market research and consulting company. With over 17 years’ experience and professional research team in various cities over the world QY Research focuses on management consulting, database and seminar services, IPO consulting, industry chain research and customized research to help our clients in providing non-linear revenue model and make them successful. We are globally recognized for our expansive portfolio of services, good corporate citizenship, and our strong commitment to sustainability. Up to now, we have cooperated with more than 60,000 clients across five continents. Let’s work closely with you and build a bold and better future.
QYResearch is a world-renowned large-scale consulting company. The industry covers various high-tech industry chain market segments, spanning the semiconductor industry chain (semiconductor equipment and parts, semiconductor materials, ICs, Foundry, packaging and testing, discrete devices, sensors, optoelectronic devices), photovoltaic industry chain (equipment, cells, modules, auxiliary material brackets, inverters, power station terminals), new energy automobile industry chain (batteries and materials, auto parts, batteries, motors, electronic control, automotive semiconductors, etc.), communication industry chain (communication system equipment, terminal equipment, electronic components, RF front-end, optical modules, 4G/5G/6G, broadband, IoT, digital economy, AI), advanced materials industry Chain (metal materials, polymer materials, ceramic materials, nano materials, etc.), machinery manufacturing industry chain (CNC machine tools, construction machinery, electrical machinery, 3C automation, industrial robots, lasers, industrial control, drones), food, beverages and pharmaceuticals, medical equipment, agriculture, etc.
About Us:
QYResearch founded in California, USA in 2007, which is a leading global market research and consulting company. Our primary business include market research reports, custom reports, commissioned research, IPO consultancy, business plans, etc. With over 18 years of experience and a dedicated research team, we are well placed to provide useful information and data for your business, and we have established offices in 7 countries (include United States, Germany, Switzerland, Japan, Korea, China and India) and business partners in over 30 countries. We have provided industrial information services to more than 60,000 companies in over the world.
Contact Us:
If you have any queries regarding this report or if you would like further information, please contact us:
QY Research Inc.
Add: 17890 Castleton Street Suite 369 City of Industry CA 91748 United States
EN: https://www.qyresearch.com
Email: global@qyresearch.com
Tel: 001-626-842-1666(US)
JP: https://www.qyresearch.co.jp