QY Research Inc. (Global Market Report Research Publisher) announces the release of 2025 latest report “Hydrogen-induced Cracking Resistant Steel- Global Market Share and Ranking, Overall Sales and Demand Forecast 2026-2032”. Based on current situation and impact historical analysis (2020-2024) and forecast calculations (2026-2032), this report provides a comprehensive analysis of the global Hydrogen-induced Cracking Resistant Steel market, including market size, share, demand, industry development status, and forecasts for the next few years.
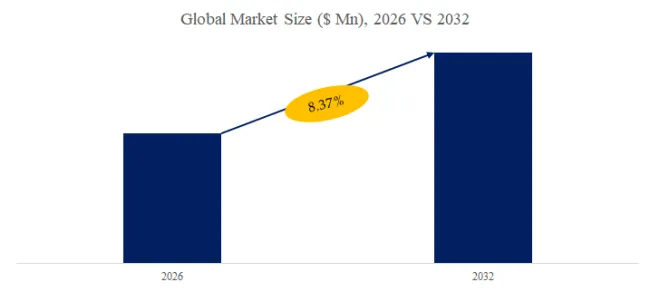
The global market for Hydrogen-induced Cracking Resistant Steel was estimated to be worth US$ 981 million in 2025 and is projected to reach US$ 1487 million, growing at a CAGR of 6.1% from 2026 to 2032.
【Get a free sample PDF of this report (Including Full TOC, List of Tables & Figures, Chart)】
https://www.qyresearch.com/reports/6261835/hydrogen-induced-cracking-resistant-steel
Hydrogen-induced Cracking Resistant Steel Market Summary
Hydrogen‑induced cracking (HIC) resistant steel is a class of high-performance steels specifically designed to mitigate the embrittlement and crack propagation caused by hydrogen atoms. Hydrogen can diffuse into metallic structures and interact with microscopic defects or alloying elements, inducing the formation and growth of microcracks that can eventually lead to brittle failure. This phenomenon is particularly prevalent in high-pressure gas transport, offshore environments, hydrogen storage and transport facilities, and the oil and gas industry. To address this, HIC-resistant steels are carefully engineered with controlled levels of carbon, sulfur, and phosphorus, while alloying elements such as nickel, molybdenum, and copper are incorporated to enhance toughness and corrosion resistance. Microstructural optimization, including refined grain size, precipitate distribution, and dislocation network management, inhibits hydrogen migration paths. Heat treatment techniques such as normalizing, quenching and tempering, and surface hardening further improve toughness and crack resistance. Collectively, these measures significantly delay crack initiation and propagation under hydrogen exposure, enhancing structural safety and service life. HIC-resistant steels are now critical materials for pipelines, pressure vessels, hydrogen storage tanks, offshore platforms, and high-pressure hydrogen transport systems, representing an evolution of steel from traditional load-bearing to environmental adaptability and safety reliability.
The current HIC-resistant steel market is characterized by simultaneous technological advancement and application expansion. The energy transition and growth of the hydrogen economy are primary drivers, with global green energy policies accelerating the construction of hydrogen transport and storage infrastructure, directly stimulating demand. Leading steel producers are advancing product quality and reliability through R&D, material modification, surface treatments, and intelligent inspection technologies, while providing customized solutions for varied operational conditions. The market is highly concentrated, dominated by a few internationally recognized steelmakers, with competition focusing on material innovation, certification, and engineering application track records. Challenges remain, including high R&D costs, complex production processes, inconsistent standards and testing methods, and limited awareness or acceptance of high-performance steels in certain regions. Overall, the market is moving toward high value-added, technology-intensive, and safety-reliable products, with increasing emphasis on brand, service, and technical support.
Looking forward, the development of HIC-resistant steels will become increasingly diverse and refined. Material design will integrate advanced simulation and computational methods to accurately predict hydrogen diffusion and crack initiation. Production processes are trending toward low-carbon, energy-efficient, and intelligent manufacturing, while surface modification and coating technologies further enhance hydrogen environment tolerance. Digital inspection and online monitoring systems will allow real-time tracking of material performance and early risk warning. On the application side, rapid growth in hydrogen-powered transportation, energy storage, electrolysis-based hydrogen production, and offshore engineering will broaden demand, while steels will evolve toward lighter weight, higher strength and toughness, and multi-environment adaptability. Furthermore, interdisciplinary research and industry collaboration will drive standardization, with deep integration of material innovation and engineering needs becoming the core driver for sustainable industry growth, positioning HIC-resistant steels as a pivotal component of future energy and industrial infrastructure development.
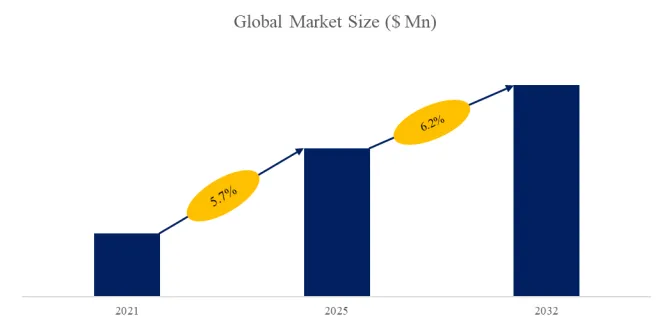
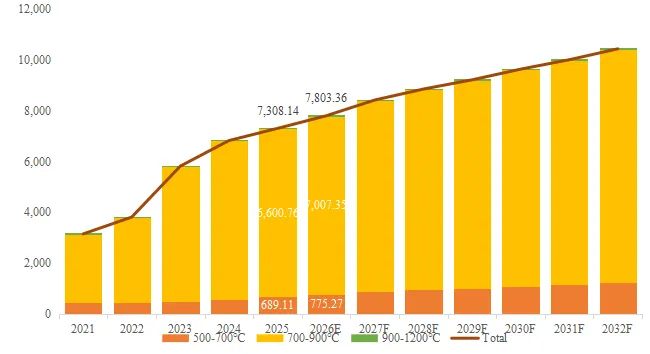
According to the new market research report “Global Hydrogen-induced Cracking Resistant Steel Market Report 2026-2032″, published by QYResearch, the global Hydrogen-induced Cracking Resistant Steel market size is projected to grow from USD 981 million in 2025 to USD 1487 million by 2032, at a CAGR of 6.1% during the forecast period.
Figure00002. Global Hydrogen-induced Cracking Resistant Steel Market Size (US$ Million), 2021-2032

Above data is based on report from QYResearch: Global Hydrogen-induced Cracking Resistant Steel Market Report 2025-2031 (published in 2025). If you need the latest data, plaese contact QYResearch.
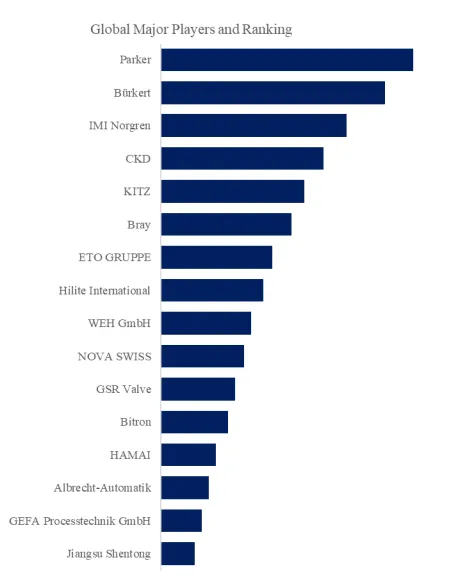
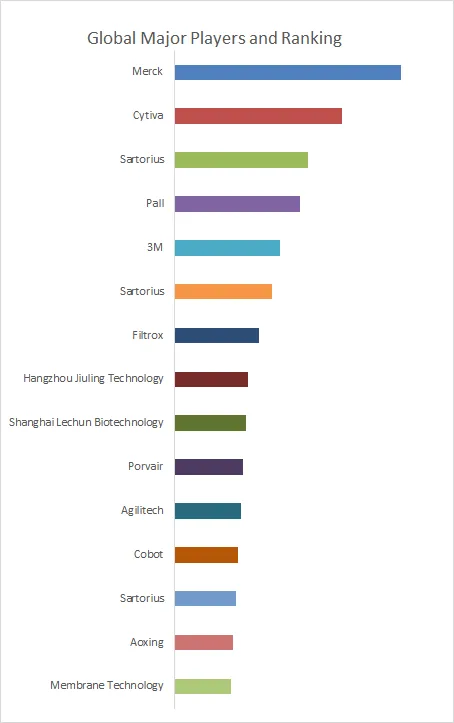
Figure00003. Global Hydrogen-induced Cracking Resistant Steel Top 12 Players Ranking and Market Share (Ranking is based on the revenue of 2025, continually updated)
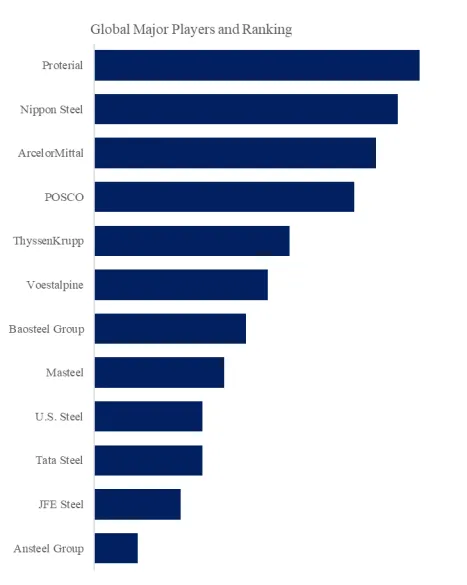
Above data is based on report from QYResearch: Global Hydrogen-induced Cracking Resistant Steel Market Report 2025-2031 (published in 2025). If you need the latest data, plaese contact QYResearch.
According to QYResearch Top Players Research Center, the global key manufacturers of Hydrogen-induced Cracking Resistant Steel include Proterial, Nippon Steel, ArcelorMittal, POSCO, ThyssenKrupp, Voestalpine, Baosteel Group, Masteel, U.S. Steel, Tata Steel, etc. In 2025, the global top five players had a share approximately 55.2% in terms of revenue.
The report provides a detailed analysis of the market size, growth potential, and key trends for each segment. Through detailed analysis, industry players can identify profit opportunities, develop strategies for specific customer segments, and allocate resources effectively.
The Hydrogen-induced Cracking Resistant Steel market is segmented as below:
By Company
Proterial
Nippon Steel
ArcelorMittal
POSCO
ThyssenKrupp
Voestalpine
Baosteel Group
Masteel
U.S. Steel
Tata Steel
JFE Steel
Ansteel Group
Dillinger Group
Segment by Type
Chromium Molybdenum Steels
Austenitic Stainless Steels
Other
Segment by Application
Oil and Gas
Refining and Petrochemicals
Hydrogen Storage and Transport
Power and Nuclear
Others
Each chapter of the report provides detailed information for readers to further understand the Hydrogen-induced Cracking Resistant Steel market:
Chapter 1: Introduces the report scope of the Hydrogen-induced Cracking Resistant Steel report, global total market size (valve, volume and price). This chapter also provides the market dynamics, latest developments of the market, the driving factors and restrictive factors of the market, the challenges and risks faced by manufacturers in the industry, and the analysis of relevant policies in the industry. (2021-2032)
Chapter 2: Detailed analysis of Hydrogen-induced Cracking Resistant Steel manufacturers competitive landscape, price, sales and revenue market share, latest development plan, merger, and acquisition information, etc. (2021-2026)
Chapter 3: Provides the analysis of various Hydrogen-induced Cracking Resistant Steel market segments by Type, covering the market size and development potential of each market segment, to help readers find the blue ocean market in different market segments. (2021-2032)
Chapter 4: Provides the analysis of various market segments by Application, covering the market size and development potential of each market segment, to help readers find the blue ocean market in different downstream markets.(2021-2032)
Chapter 5: Sales, revenue of Hydrogen-induced Cracking Resistant Steel in regional level. It provides a quantitative analysis of the market size and development potential of each region and introduces the market development, future development prospects, market space, and market size of each country in the world..(2021-2032)
Chapter 6: Sales, revenue of Hydrogen-induced Cracking Resistant Steel in country level. It provides sigmate data by Type, and by Application for each country/region.(2021-2032)
Chapter 7: Provides profiles of key players, introducing the basic situation of the main companies in the market in detail, including product sales, revenue, price, gross margin, product introduction, recent development, etc. (2021-2026)
Chapter 8: Analysis of industrial chain, including the upstream and downstream of the industry.
Chapter 9: Conclusion.
Benefits of purchasing QYResearch report:
Competitive Analysis: QYResearch provides in-depth Hydrogen-induced Cracking Resistant Steel competitive analysis, including information on key company profiles, new entrants, acquisitions, mergers, large market shear, opportunities, and challenges. These analyses provide clients with a comprehensive understanding of market conditions and competitive dynamics, enabling them to develop effective market strategies and maintain their competitive edge.
Industry Analysis: QYResearch provides Hydrogen-induced Cracking Resistant Steel comprehensive industry data and trend analysis, including raw material analysis, market application analysis, product type analysis, market demand analysis, market supply analysis, downstream market analysis, and supply chain analysis.
and trend analysis. These analyses help clients understand the direction of industry development and make informed business decisions.
Market Size: QYResearch provides Hydrogen-induced Cracking Resistant Steel market size analysis, including capacity, production, sales, production value, price, cost, and profit analysis. This data helps clients understand market size and development potential, and is an important reference for business development.
Other relevant reports of QYResearch:
Global Hydrogen-induced Cracking Resistant Steel Market Outlook, In‑Depth Analysis & Forecast to 2032
Global Hydrogen-induced Cracking Resistant Steel Market Research Report 2026
Global Hydrogen-induced Cracking Resistant Steel Sales Market Report, Competitive Analysis and Regional Opportunities 2026-2032
Global Hydrogen-Induced Cracking Resistant Steel Plate Market Outlook, In‑Depth Analysis & Forecast to 2032
Global Hydrogen-Induced Cracking Resistant Steel Plate Sales Market Report, Competitive Analysis and Regional Opportunities 2026-2032
Global Hydrogen-Induced Cracking Resistant Steel Plate Market Research Report 2026
Hydrogen-Induced Cracking Resistant Steel Plate- Global Market Share and Ranking, Overall Sales and Demand Forecast 2026-2032
About Us:
QYResearch founded in California, USA in 2007, which is a leading global market research and consulting company. Our primary business include market research reports, custom reports, commissioned research, IPO consultancy, business plans, etc. With over 19 years of experience and a dedicated research team, we are well placed to provide useful information and data for your business, and we have established offices in 7 countries (include United States, Germany, Switzerland, Japan, Korea, China and India) and business partners in over 30 countries. We have provided industrial information services to more than 60,000 companies in over the world.
Contact Us:
If you have any queries regarding this report or if you would like further information, please contact us:
QY Research Inc.
Add: 17890 Castleton Street Suite 369 City of Industry CA 91748 United States
EN: https://www.qyresearch.com
Email: global@qyresearch.com
Tel: 001-626-842-1666(US)
JP: https://www.qyresearch.co.jp